Analyzing Hospital Discharge Data
150 likes | 180 Vues
Analyzing Hospital Discharge Data. David Madigan Rutgers University. Comparing Outcomes Across Providers. Florence Nightingale wrote in 1863:.

Analyzing Hospital Discharge Data
E N D
Presentation Transcript
Analyzing Hospital Discharge Data David Madigan Rutgers University
Comparing Outcomes Across Providers • Florence Nightingale wrote in 1863: “In attempting to arrive at the truth, I have applied everywhere for information, but in scarcely an instance have I been able to obtain hospital records fit for any purposes of comparison…I am fain to sum up with an urgent appeal for adopting some uniform system of publishing the statistical records of hospitals.”
Data • Data of various kinds are now available; e.g. data concerning all medicare/medicaid hospital admissions in standard format UB-92; covers >95% of all admissions nationally • Considerable interest in using these data to compare providers (hospitals, physician groups, physicians, etc.) • In Pennsylvannia, large corporations such as Westinghouse and Hershey Foods are a motivating force and use the data to select providers.
Pennsylvannia Healthcare Cost Containment Council. 2000-1, n=800,000
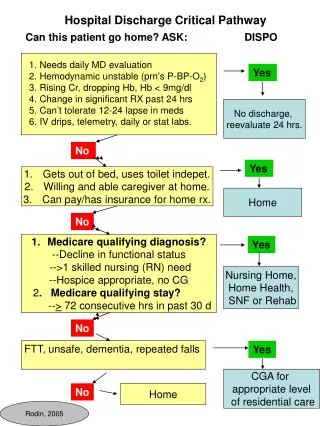
Risk Adjustment • Discharge data like these allow for comparisons of, e.g., mortality rates for CABG procedure across hospitals. • Some hospitals accept riskier patients than others; a fair comparison must account for such differences. • PHC4 (and many other organizations) use “indirect standardization” • http://www.phc4.org
p-value computation n=463; suppose actual number of deaths=40 e=29.56; p-value = p-value < 0.05
Concerns • Ad-hoc groupings of strata • Adequate risk adjustment for outcomes other mortality? Sensitivity analysis? Hopeless? • Statistical testing versus estimation • Simpson’s paradox
A SMR = 24/18 = 1.33; p-value = 0.07 B SMR = 66/42 = 1.57; p-value = 0.0002
Hierarchical Model • Patients -> physicians -> hospitals • Build a model using data at each level and estimate quantities of interest
Bayesian Hierarchical Model MCMC via WinBUGS
Discussion • Markov chain Monte Carlo + compute power enable hierarchical modeling • Software is a significant barrier to the widespread application of better methodology • Are these data useful for the study of disease?