Download
1 / 43
440 likes | 458 Vues
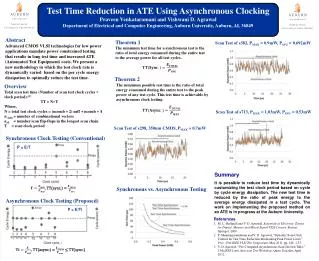
This research focuses on reducing Automatic Test Equipment (ATE) time by scaling voltage and frequency. Key aspects include power constraints, test economics, and techniques for test time reduction. The study explores power metrics, scan chains, and serializer-deserializer structures in testing methods. The impact of reduced supply voltage on testing effectiveness is also examined, offering insights on potential fault detection benefits and performance alterations.

E N D
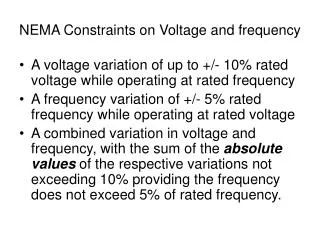
Reducing ATE Test Time by Voltage and Frequency Scaling Committee Members: Prof. Vishwani D. Agrawal (Chair) Prof. Fa Foster Dai Prof. Adit Singh External Reader: Prof. Sanjeev Baskiyar BY Praveen Venkataramani
Acknowledgment • Prof. Vishwani Agrawal for his invaluable guidance throughout my work, • Prof. Adit Singh and Prof. Foster Dai for being my committee members and for their courses, • Prof. SanjeevBaskiyar for being my external reader, • Prof. Victor Nelson for his course on CAD tools which helped me understand the tools I used, for assisting me with the ATE issues and calibrations, • All staff members of EE department, • My friends and family for their support throughout my research. Final Defense
Overview • Background • Theorem • Scaling Voltage • Scaling Frequency • Conclusion Final Defense
Background • Types of device under test • Combinational – simpler to model and generate patterns • Sequential – more complex and hard to generate patterns Final Defense
Scan chains Combo Logic PI PO SO DFF DFF SI SE Circuits with many flip flop groups connected as a chain, each group is shown in one color Final Defense
Testing Methods AUTOMATIC TEST EQUIPMENT Final Defense
What is an ATE? • Automatic test equipment • Used to generate patterns and clock, to test circuits in real time • Contains • Main frame- contains the main power supply • User Interface – Interface between the user and the ATE • Test head – measurement modules and test head • Has limited channels and memory • Is expensive. • The time spent on the tester is added to the cost of a chip. • Reducing cost of chip -> spend less time on the ATE Final Defense
Test cost economics- example [LTXC’10] Final Defense
Test cost economics- example • The cost analysis according to [Bushnell and Agrawal ’00] is given as Running Cost = Depreciation + Maintenance + Operating Cost • Using the data in the table , Final Defense
Test cost economics- example Final Defense
Test time and power • Test pattern have almost no functional relation, and are only to activate and observe a fault. • Unwanted signal transitions may be caused in the circuit, thus causing excessive power dissipation. • Excessive power dissipation might cause “overtest” where a good device might fail due to IR drop delays or failure in the chip due to overheating. • Increase the time period => Lower power => increased test time, or • Reduce energy by choosing patterns that lower signal transitions => more patterns to achieve high fault coverage => increased test time. Final Defense
Power Metrics [Girard ‘10] • Energy per cycle: Energy dissipated due to switching activity in one clock cycle. • Power per cycle: It is the energy dissipated during one clock cycle divided by the period. • Average power: It is total energy dissipated over the entire test divided by the test time. • Maximum power: It is the maximum power consumed by any one cycle during the entire test. • Maximum energy: It is the energy dissipated by the cycle having the maximum signal transitions. • Total energy: It is the energy dissipated during the entire test. Final Defense
Problem Statement • Power consumption during test must not exceed the specified budget often implying increased test time. • Long test time increases cost; test time can be very long for scan based testing. • Need to reduce test time without exceeding power budget. Final Defense
Test time reduction techniques Original tests: V1 V2 V3 V4 V5 Reordered tests: V1 V3 V5 V4 V2 SI SO 1 1 0 0 0 1 0 1 0 0 1 0 1 0 1 1 0 1 1 1 1 0 0 0 1 1 1 0 0 0 1 1 1 0 0 1 1 1 1 0 Multiple scan chains Test vector Reordering [Chloupek’12] Serializer Deserializer M I S R SI P R P G SO Combo Logic SerDes scan structure [Sanghani ‘11] Built In Self Test + ATE [Hashempour’02] Final Defense
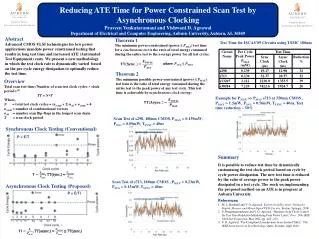
Test time theorem • For power constrained testing where the peak power during any clock must not exceed the rated power of the device, the test time has a lower bound, where ETOTAL(test)is the total energy consumed during the entire test, PMAX(rated) is the maximum rated power for the device, PAVG is the average power of the entire test and TT is the total test time. Final Defense
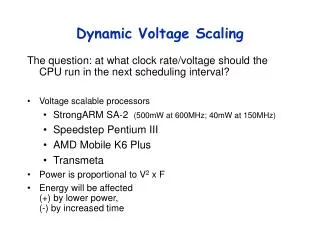
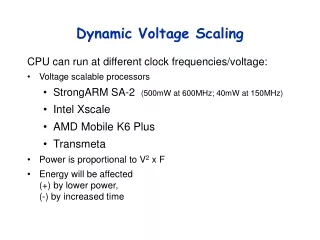
Test power per cycle • Test Time can be reduced by • Scaling the power supply used for test • Varying the frequency based on the power dissipated during each cycle Final Defense
Reduced supply voltage test • Test at lower than nominal supply voltage has existed from early 90’s. [Hao and McClusky ‘93] • Effects of low supply voltage tests are – • Resistive shorts and hot carrier defects are more pronounced. • Force malfunction of weak chips, while retaining truly good ones. • Gate delay increases but wire delay is not affected much. • Changes in critical paths. • Alternative to expensive burn-in tests. • Can detect pattern dependent faults Final Defense
Effects of scaling supply voltage • Certain effects are to be considered- • Change in the critical path – can be observed by implementing a critical path monitor • Effects of threshold voltage variations due to variations in the manufacturing process. • In this work we assume • There are no critical path variation • There are no threshold voltage variations • Gate delay can be approximated by using a alpha power law delay model. [Sakurai and Newton ‘90] • Effect of voltage variation on the critical path delay can be observed by simulating a chain of inverters. Final Defense
Alpha power law delay model • The gate delay can be approximated using Where, is the velocity saturation index, 1 if velocity saturated and 2 if no velocity saturation, K is a proportionality constant, is the supply voltage, is the threshold, is the delay. Final Defense
Chain of Inverters • Chain was simulated for every voltage • Delay at each voltage is measured • Initial delay was calculated with arbitrary values for the unknowns • Curve fitting was used to find the actual values for the unknowns • The velocity saturation index was found to be 2. • The value for K is circuit dependent IN OUT Final Defense
Scaled test supply voltage • Quadratic reduction in power. • Critical path delay increases. • Power dissipation depends on the time period used • To maintain the same power dissipation, clock period can be reduced. • Power constrain: A test is power constrained, if the minimum test clock period is limited by the maximum rated power for the circuit under test. • Structure constrain: A test is structure constrained if the minimum test clock period is limited by the structural (critical path) delay of the circuit under test. Final Defense
Scaling test supply voltage Final Defense
s298 Example Final Defense
Optimum voltage • For minimum test time,the period should satisfy both structure and power constraints. i.e. • The test period based on our observation, the test clock period is equal to the structural clock period at the voltage . • Equating the test period and the structural delay at we will get • If and , then • Since the highest power is 3 and is solvable using any Numerical solver such as MATLAB. Final Defense
Optimum voltage Final Defense
Simulation results Final Defense
Matlabresults Final Defense
Revisiting periodic clock test Final Defense
Scaling test clock frequency • From the theorem, the total test time using a conventional periodic clock test can be written as • To obtain the lower bound for test time => Denominator must be large. • The arithmetic mean is maximum when all the values in the function is equal to the maximum value of that function. • Implies, for , every cycle must dissipate the power equal to Final Defense
Aperiodic test Final Defense
Aperiodic clock test • Each period can be either structure constrained or power constrained, i.e., where, Ti is the period of each test cycle Eiis the energy dissipated by each cycle • This is termed as aperiodic clock test where each cycle may not use exactly the same period as its neighboring cycle. • For any given voltage an aperiodic clock test can run faster than the periodic clock test at that voltage Final Defense
s298 circuit example Aperiodic Clock Periodic Clock Final Defense
Aperiodic clock simulation results Final Defense
Experiments on ATE • Experimental Setup • The test was implemented on the Advantest T2000GS ATE at Auburn University. • Maximum clock speed of 250 MHz • CUT is an FPGA configured for ISCAS‘89 benchmark circuit. • FPGA is configured on the run using the ATE. • All clock periods for aperiodic clock test are determined prior to external test based on the amount of energy dissipated during each cycle. • Limitations in tester framework sets few margins to the clock periods and the granularity in their variations • Only 4 unique clock periods can be provided for each test flow Final Defense
Changes to test programming • The clock periods were grouped into 4 sets. • Each set contains patterns of one clock period. • For periodic test the maximum period is used as the fixed clock period. • The figure shows the cycle periods determined for each test cycle. • Test cycle will use the clock (dotted line) just above the period Final Defense
Periodic clock test period Final Defense
Aperiodic test on ATE Final Defense
Scaling supply voltage- Aperiodic Test Final Defense
Experimental results - s298 Final Defense
Simulation results Final Defense
Conclusion • Periodic test time is reduced by, • Scaling supply voltage down • Scaling cycle frequency upward • Aperiodic clock test produces lower test time at any voltage as long as there are some test cycles that are power constrained. • According to the test time theorem, aperiodic test time is always less than or equal to the periodic test time. • Future works • Finding optimum number of periods for aperiodic clock test to achieve better test time reduction. • Include process variations and make the method more adaptive. Final Defense
Posters and Papers Presented • Praveen Venkataramani, Vishwani D. Agrawal, “ATE Test Time Reduction Using Aperiodic Clock Test,” Proc. International Test Conference, Anaheim CA, 2013, Paper 15.3. • Praveen Venkataramani, SurajSindia, Vishwani D. Agrawal, “A Test Time Theorem and Its Applications,”Proc.14th Latin American Test Workshop (LATW), April 2013, pp.1-5. • Praveen Venkataramani, SurajSindia, Vishwani D. Agrawal “Finding Best Voltage and Frequency to Shorten Power Constrained Test Time,”Proc. 31st IEEE VLSI Test Symposium, April 2013, pp. 19-24. • Praveen Venkataramani, Vishwani D. Agrawal “Reducing Test Time of Power Constrained Test by Optimal Selection of Supply Voltage,”Proc. 26th International Conference on VLSI Design, Jan. 2013, pp. 273-278. • Praveen Venkataramani, Vishwani D. Agrawal “Test-Time Reduction in ATE Using Aperiodic Clocking,”6th IEEE International Workshop on Design for Manufacturing and Yield, San Francisco, CA, 4 July 2012 (Poster). • Praveen Venkataramani, Vishwani D. Agrawal “Reducing Test Time for Power Constrained Scan Circuits Using Aperiodic Clocking,”International Test Conference, Anaheim, CA, 5-9 November 2012 (Poster). Final Defense
References • [AGILENT_EDITORIAL] http://www.home.agilent.com/agilent/editorial.jspx?&id=875011&cc=US&lc=eng • [Girard’10] P. Girard, N. Nicolici, and X. Wen, Power Aware Testing and Test Strategies for Low Power Devices, Springer Publications 2010, New York, ISBN-978-1-4419-0927 • [Hashempour’02] H. Hashempour, F. J. Meyer, and F. Lombardi, “Test Time Reduction in a Manufacturing Environment by Combining BIST and ATE,” in Proc. 17th IEEE International Symposium on Defect and Fault Tolerance in VLSI Systems, 2002, pp. 186–194. • [Shanmugasundaram’12] P. Shanmugasundaram and V. D. Agrawal, “Externally Tested Scan Circuit with Built-In Activity Monitor and Adaptive Test Clock,” in Proc. 25th International Conf. VLSI Design, Jan. 2012, pp. 448–453. • [Chloupek’12] M. Chloupek, O. Novak, and J. Jenicek, “On Test Time Reduction Using Pattern Overlapping, Broadcasting and On-Chip Decompression,” in Proc. IEEE 15th International Symp. on Design and Diagnostics of Electronic Circuits Systems (DDECS), Apr. 2012, pp. 300–305. • [Sanghani ‘11] Sanghani, A.; Bo Yang; Natarajan, K.; Chunsheng Liu, "Design and implementation of a time-division multiplexing scan architecture using serializer and deserializer in GPU chips," Proc. 29th IEEE VLSI Test Symposium (VTS), May 2011, pp. 219,224. Final Defense