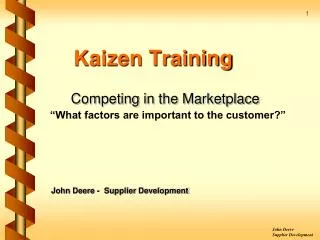
Value Stream Analysis Kaizen Training
Value Stream Analysis Kaizen Training. What you can Expect. “Value Stream Analysis Kaizen Training” contains what you need to know to get the job done, not everything you need to know to be an expert. Part 1 Lean concepts and terminology Part 2 The process by which we create future states.

Value Stream Analysis Kaizen Training
E N D
Presentation Transcript
What you can Expect • “Value Stream Analysis Kaizen Training” contains what you need to know to get the job done, not everything you need to know to be an expert. • Part 1 • Lean concepts and terminology • Part 2 • The process by which we create future states
Lean Thinking • Value in the Eyes of the Customer • The ValueStream • Flow • Pullof the Customer • Perfection
Value Added • Value is added any time we physically change our product towards what the customer is buying • If we are not adding value, we are adding cost or waste • Lean Manufacturing drives the systematic elimination of waste Value-Added Time : Minutes Time in Plant : Weeks ORDER CASH KEY QUESTION – Are my customers willing to pay for this ????
Value Added vs. Non-Value Added Value added 5% Non-value added Typically 95% of Total Lead Time is Non-Value Added!!! LEAN = ELIMINATING THE 7 WASTES • Overproduction • Waiting • Transportation • Non-value added processing • Excess inventory • Excess motion • Defects
OVERPRODUCTION 7 TRANSPORTATION INVENTORY Wastes PROCESSING DEFECTS WAITING MOTION ELIMINATE
7 Basic Types of Waste (Toyota) • Overproduction – producing more than what is demanded by the customer • Inventory – Storing more than the absolute minimum needed • Transportation – the unnecessary movement of materials • Waiting – waiting for the next process step • Excess processing – due to poor tool or product design • Wasted motion – unnecessary reaching, walking, looking for parts, tools, prints, etc • Defects – scrap and rework
What is Flow ? • Producing and moving one item at a time (or a small and consistent batch of items) through a sequence of process steps as continuously as possible, with each step making just what is requested by the next step. TRADITIONAL CONTINUOUS FLOW Lean Lexicon Version 1 p9
Continuous Flow – More Efficient & Faster Traditional Batch Layout Continuous Flow Layout
Supermarket Pull System “Production” KANBAN “Withdrawal” KANBAN product product Mike RotherLearning to See SUPERMARKET CUSTOMER PROCESS goes to supermarket and withdraws what it needs when it needs it. SUPPLYING PROCESS produces to replenish what was withdrawn. PURPOSE: Controls production at supplying process without trying to schedule. Controls production between flows.
Takt Time Customer 880 units/month = = 44 units/day Requirement 20 days/month 440 mins/day Takt time = = 10 mins/unit 44 units/day Takt time paces production to the pace of customer requirements. Total daily operating time Takt Time = Total daily customer requirement Operating time = 1 shift x 8 hours – (2) 20-min. breaks = 440 mins/day
What is a ValueStream ? • A ValueStream is all the actions, value creating and non-value creating, required to bring a product from order to delivery • Starts with raw materials • Finalizes at the end-customer • Involves several businesses
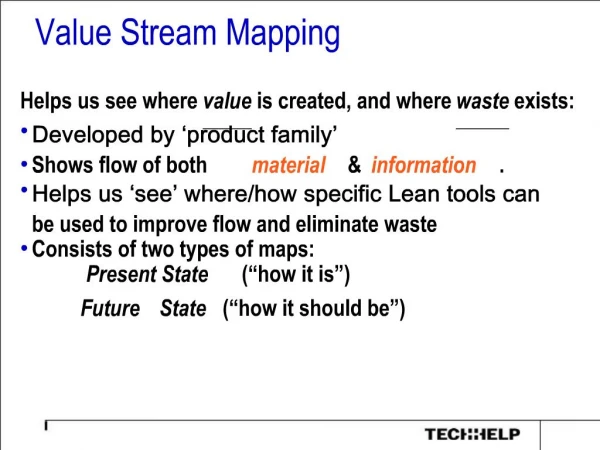
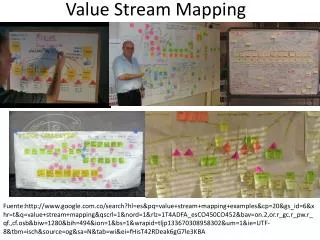
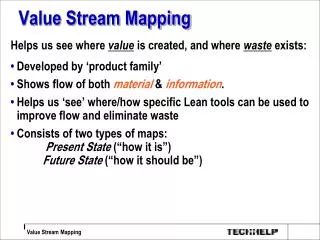
Value Stream Mapping • Helps you to see the sources of waste in the value stream • Shows the flow of information and material • Forms the blueprint for lean implementation (Imagine trying to build a house without a blueprint). • Helps you to see more than just the single process level • Provides a common language for talking about manufacturing processes • Makes decisions about the flow apparent, so they can be discussed • Ties together lean concepts and techniques, which helps to avoid “cherry picking” Improvement projects Mike RotherLearning to See
What is Value Stream Analysis? • Value stream maps describe a value stream • Value stream analysis is a planning process • Uses value stream maps to communicate • Information Flow • Material Flow • Three value stream maps are created • Current state • Ideal state • Future state (3 months from now) • Action plans are developed for the future state map
The Value Stream Analysis Process • Phase 1-Pre-event work • Phase 2-The Main Event • Phase 3-Accountability Process
Pre-Event Work • Three weeks prior to the event • Determine team members • Define the objective of the team • Select the area and topic • Logistics (conf. Rm., times, facilitator supplies, etc.) • Invite team members to the event • Clarify roles and responsibilities • Event leader-value stream manager from the area (owns resources and results) • Event facilitator-CI Leaders who manage the improvement process and share in ownership of results • Subject matter experts
Pre-Event Work • Two weeks prior to the event • Part/quantity analysis (select representative part number) • Gather and review data (Yield, job closures, CONC, etc.) • Determine future demand • Review prior event data • Review any customer issues • Review any requirements for capital equipment • One week prior to the event • Verify customer demand • Review above data
The Main Event • Training • Gemba Walk • Value Stream Map-Current State • Develop Ideal State Map • Develop Future State Map (3 months out) • Develop Future State Plan • Management Report Out
VSM Event Steps 1 &2Training and Gemba Walk • Training • The concepts of Lean need to be applied to classroom training as well as our other processes • This is a learn by doing process • We will minimize classroom learning • Gemba Walk • Gemba means, “shop floor” or “where the process is” • We need to go there so we know what we are mapping
VSM Event Step 3Current State Map • Value Stream Map-Current State • Map the physical flow (manufacturing loop, customer loop, supplier loop) • Map the information flow • Complete the lead time data bar • Visually identify waste • Identify value added/non-value added (red, yellow, green dots) • Visually identify the most significant opportunities with kaizen bursts. • Summarize all information and metrics (date, P/N, times, inventory, OTD, quality, etc.)
Elements of Value Stream Maps Customer Supplier 880 Monthly Orders 30 Days MRP Takt Time = 440 min/44 = 10 min/unit Bi-Monthly Op 1 Op 2 Op 3 Op 4 Op 5 Op 6 45 Days 2 Days 2 Days 5 Days 1 Day 1 Day 1 Day S/U = 0.08 hrCT = 0.9 min S/U = 0.08 hrCT = 0.9 min S/U = 0 CT = 60 min S/U = 0.08 hrCT = 1.2 min S/U = 1.95 hr CT = 40.3 min S/U = 1 hrCT = 1.6 min 45 1 2 2 1 5 1 1.6 0.9 0.9 60 1.2 40.3 Total = 57 DaysTotal = 1 Hr. 44.9 Min. Information Supplier Loop Customer Loop Manufacturing Loop Lead Time Data Bar
Manufacturing Loop Questions • What are the changeover times? • What are the quantity of machines per process? • Count all work in process (WIP) • Look for evidence of quality problems • Look for processing waste • Is there great distances between processes? • Is the product flexible or made to order? • Is there obvious batch processing?
G.M. AT&T Customer Loop Questions • Who and where are your customers? • What are the product lines or families? • Future marketing plans? Review growth • potential. • What is the total yearly order requirement? Quantity by product family or product type • What is the high, low and mean ordering pattern? Monthly or quarterly high & low for several periods • How often do we deliver to our customer? • What takt time do we supply to?
Production Control Questions • Where in the production chain do we trigger production? • How much work do we release at one time? • How long does it take to go from customer order to production order? • How do we physically schedule production? • How do we react to customer emergencies?
Supplier Loop Questions • #1 question, how do you tell supplierswhat to ship, make, etc.? • When and how often do they get purchaseorders from Customers? • When and how do we change the purchase order? • When and how often do suppliers ship product and how?Is it level? (Truck, train, etc.) • Do we have standard pack quantities? • Are suppliers aware of our inventory quantities? • Are we sure of suppliers inventory? How? • Do we have a supplier training program?
Information Flow Questions • How are the manufacturing and procurement orders distributed? • Who gets them • How frequently • What is the process of generating them • How are the shop order schedules generated and revised? Are there “shortage meetings”? What parts of the manufacturing loop are scheduled by MRP? Make sure to document the informal (hot lists) as well as formal (MRP) information channels.
Current State Lead Time Data Bar Lead Time Total Cycle Time (CT) DOH Inventory 8 Days 4 Days 12 Days 4 Hrs (1 Hr.) 4 Hrs VA Time (yes/no) CT Total
COMPUTER WIP Mapping Icons
Visually Identify Waste • As a team, review each process step for elements that are value added and non value added • Each step can have any combination of value added, type 1 waste and/or type 2 waste • Identify value added with a green dot • Identify type 1 waste (waste but unavoidable in the current state) with a yellow dot • Identify type 2 waste (pure waste, eliminate immediately) with a red dot • As type 2 waste is identified, generate the actions to remove it (this will be the beginning of the future state implementation plan) • Prioritize the waste opportunities and identify the biggest opportunities on the CS map with kaizen bursts
VSM Event Step 4Ideal State Map • Avoid shared resources • Assume that anything is possible • Our customers are happy • Our profits are up • High job satisfaction • Capital is available if needed • Create an ideal state map • Map the physical flow • Map the information flow • Complete the lead time data bar
VSM Event Step 5Future State Map (3 months out) • What of the ideal state map can be implemented in 3 months? • Identify short term goals • LEAD TIME • INVENTORY • PRODUCTIVITY • QUALITY • CAPACITY • Work from your current state map
VSM Event Step 6Future State Plan • This plan answers the question, “what actions need to be completed in the next 90 days to achieve the future state? • Think back to the “visually identify waste” step • Plan addresses all “red dots” and Kaizen bursts
VSM Event Step 7Management Report Out • This report out is how the team publicly commits to management • What the goal of the event was • What was learned • What was accomplished during the event • What the outcome is. How much better will we be? • Description of the future state • Commitment of the action plan
The Accountability Process • The momentum for improvement is never higher then at the end of the event when everyone can really see the waste. As a result the accountability process must start immediately following the event (next day). • Display the current state map, future state map and future state plan in the the affected area. • Commit to a stand up meeting in front of the maps and plan (daily at first, and then less frequent as applicable) • Focus on Due date control. Not meeting dates is letting the team down