Download
1 / 26
300 likes | 624 Vues
Value Stream Analysis. Learn the basics of Value Stream Analysis Use a Value Stream Analysis as a planning tool Slides adopted from Doug Fingles, MERC. Background. Started with Henry Ford Toyota developed a process to “see” the entire flow of their products

E N D
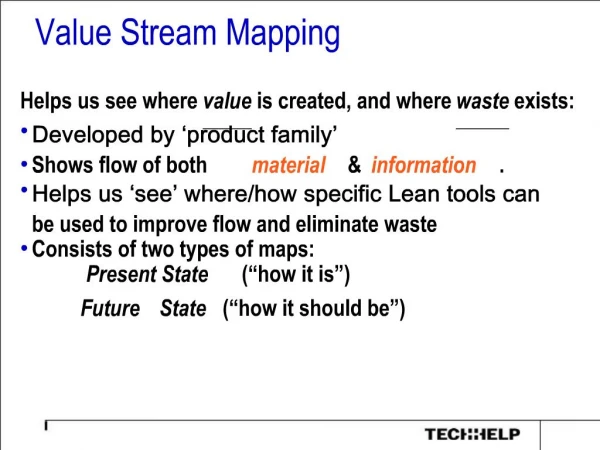
Value Stream Analysis Learn the basics of Value Stream Analysis Use a Value Stream Analysis as a planning tool Slides adopted from Doug Fingles, MERC
Background • Started with Henry Ford • Toyota developed a process to “see” the entire flow of their products • Note: Not a Japanese phenomenon—most Japanese companies do not employ Lean techniques • “Lean” is a popular buzzword in current manufacturing circles • Most companies only implement “doing” things • 6S and events are the most popular steps because people are “doing” something • Mapping the process lets you see everything • The good and the bad get highlighted • See the waste first, then plan what you'll do about it
5 Key Concepts Womack and Jones • Value • Value Stream • Flow • Pull • Perfection
Toyota Implementation of the 5 Key Concepts Askin and Goldberg • Emphasis on reducing setup times for machines • Integration of suppliers and material acquisition into the corporate planning process • Efficient cellular layouts with balanced material flow • Kanban-based pull system • Elimination of Waste • Faith in the value and importance of quality • “Kaizen” or continuous improvement as a day to day operating philosophy • Belief in the value and utilization of human resources
Definition of Value • Specific product that meets a customer’s needs at a specific price and specific time • What is important to the customer • What the customer is willing to pay for • Put yourself in the customer’s shoes • Use the customer’s words to describe the product
Definition of the Value Stream • Set of specific actions required to bring a specific product through 3 critical management tasks of all businesses • Problem Solving task (design, engineering) • Information Management task (order taking, scheduling, planning) • Physical Transformation task (from raw material to finished product)
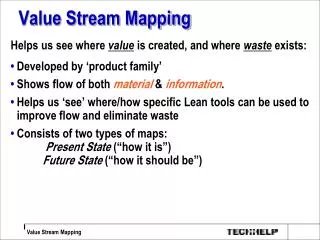
Value Stream Analysis • Will show 3 types of actions • Value • Those actions that change the product to meet the customers’ requirements • Unavoidable Waste (Type 1 Muda) • Actions that can’t be avoided for now because of technology, legal requirements, etc. • Waste (Type 2 Muda) • Actions that are avoidable such as waiting, rework, movement
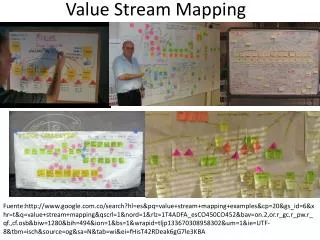
Value Stream Analysis • Use Value Stream Analysis as a planning tool • Break down the Value Stream in manageable sections • Communicate the “flow” with maps • Information • Material • Use Value Stream Analysis to create 3 maps • Current • Ideal • Future (near time-within a year) • Develop action plan from the Future map
Value Stream Analysis Steps Prepare • 1: DEFINE THE BOUNDARIES • 2: DEFINE THE VALUE • 3: SET UP THE MAP • 4: OBSERVE AND GATHER DATA • 5: MAP THE FLOW OF ITEMS • 6: MAP THE FLOW OF INFORMATION • 7: ADD DATA BOXES AND HIGHLIGHTS Current conditions Breakthroughs • 8: GO BACK TO THE GARAGE • 9: CHOOSE NATURAL GROUPS • 10: DEVELOP IDEAL STATE MAP Vision • 11: DEVELOP FUTURE STATE (6-12 MO.) MAP • 12: DEVELOP ACTION PLANS AND TRACKING Plans
1: Define the Boundaries • What process(es) will you map? • What can we not screw up? • Inputs • Outputs • Who are the customers • For the product • For the process • Top 2 or 3 measurements
2: Define the Value • Specific product that meets a customer’s needs at a specific price and specific time • Critical starting point • What is the customer buying? • Describe from customer’s viewpoint • As the process is documented, ask: Does the work being done contribute to the Value? Is the customer willing to pay for this? • Summarize (attach to the Value Stream Map)
- On-Demand Ideal - Defect-Free Goal - 1-By-1 - Lowest Cost Key Requirements Things we can’t Screw up Business Case Value Statement Measurements 3: Set Up the Map Heading
Set Up the Map • Business Case • Why are you doing this? • Value Statement • What is it that makes the customer buy your product? • Key Requirements • What can we not screw up? • Measurements • Select those 2 or 3 measurements that will get you fired if you don’t meet them • Usually along lines of quality, delivery or cost • Refer to these when developing the Future State Map and Action plan
Trigger: Done: Flow Time = Manual Cycle Time = People = WIP Pieces = C/O Time = % Yield = 4: Observe and Gather Data • Walk the Value Stream - see the actual work place • Follow and make notes about the path of each "ITEM" • Gather data for each step in the flow:
PROCESS notes and details I EXTERNAL PLACES 5: Map the Flow of Items use this box to represent each process step use this symbol for customers and suppliers use this symbol to represent a "supermarket" (first-in-first-out) use this symbol for stored inventory (known quantities) use this symbol for pushed inventory (arrow implies WIP) use this symbol for a pull system use this symbol for a first-in-first-out flow "lane" use this symbol for transportation FIFO max 10
information 6: Map the Flow of Information use this symbol for manual flow of information use this symbol for electronic flow of information use this symbol to represent information that flows (such as "schedule sequence") use this symbol for pull system paper trigger use this symbol for a pull system returnable container trigger use this symbol for pull system trigger at a particular quantity level use this symbol for pull system "go see" trigger use this symbol for pull system information storage points
Trigger: Done: Flow Time = MCT = People = WIP = % Yield = 1,200 pcs 3.2 days I 1 S 6 P 302 pcs 8.1 days 7: Add Data Boxes and Highlights add data boxes to the map to show the data that you collected (see step 4) use this symbol to show where the people are (eg. = 5 people) add numbers to the push flow symbols add numbers to the "stored inventory" symbols use this symbol to show capital equip. (eg. $ = $100k) use this symbol to show progress in establishing cells: 1 = 1-Piece Flow S = Standard Work 6 = Basic 6-S P = Pull Systems $
8: Go Back to the Garage • Pick a few items that flow through the Value Stream • Pretend you are your smallest competitor • YOU’RE IN A GARAGE WITH ALMOST NO MONEY • YOU HAVE HARDLY ANY SALES (very long takt time) • Develop the smallest, lowest capital Value Stream
9: Choose Natural Groups • Review the items that flow through the Value Stream • What factors make items similar or different • Group similar items together • Set aside items that complicate the groups • Choose a target takt time for the whole Value Stream • What factors drive the process cycle times • How many parallel flow paths do you want • What is the volume? How many shifts? • Choose target takt time for the value stream • Choose natural groups of items (add "miscellaneous")
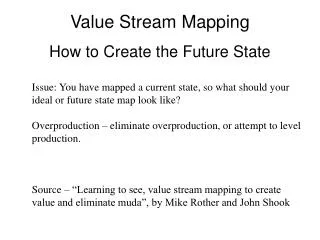
10: Develop Ideal State Map • Assume that anything is possible • Avoid shared resources, aim for 1-3 cells per path • Create an ideal state value stream map • Begin resolving possible obstacles • List possible obstacles • Start key r&d projects • Start "right-sized equipment" projects
11: Develop Future State (6-12 mo.) Map • Identify short term goals • Productivity • Floor space • Inventory • Capacity • Quality • Identify the most supportive area managers • Identify sections of the value stream easy to change • Identify the first "complete" flow path you will create • Work from your current state map
Brainstormed Ideas ACTION IDEA ACTION IDEA ACTION IDEA ACTION IDEA ACTION IDEA ACTION IDEA ACTION IDEA ACTION IDEA ACTION IDEA ACTION IDEA ACTION IDEA ACTION IDEA ACTION IDEA ACTION IDEA ACTION IDEA ACTION IDEA Events Projects Do-Its EVENT TOPIC EVENT TOPIC PRO- JECT PRO- JECT ACTION ITEM ACTION ITEM EVENT TOPIC EVENT TOPIC PRO- JECT PRO- JECT ACTION ITEM ACTION ITEM EVENT TOPIC EVENT TOPIC PRO- JECT ACTION ITEM May Jun Jul Aug Sep Oct EVENT TOPIC EVENT TOPIC EVENT TOPIC EVENT TOPIC EVENT TOPIC EVENT TOPIC EVENT TOPIC EVENT TOPIC EVENT TOPIC EVENT TOPIC EVENT TOPIC PROJECT PROJECT PROJECT Do-Its Projects Events PROJECT PROJECT PROJECT ACTION ITEM ACTION ITEM ACTION ITEM ACTION ITEM ACTION ITEM ACTION ITEM ACTION ITEM 12: Develop Action Plans and Tracking • Brainstorm action items • And… track measurements • Sort the action items • Against what we can’t screw up • Against key measurements • Develop an action plan
Follow the Process • remember that Value Stream Analysis is a process • avoid short-cuts (the steps are important) • remind yourself and your team to be disciplined • "we can skip this step" • "we already know how we want to make this" • "let's not worry about that for now" learn by doing THIS PROCESS WORKS!!
Refresher • Why are you doing a Value Stream Analysis? • what does a Value Stream Map help us do? • COMMUNICATE • Provides common language for everyone to see process • SEE WASTE • IDENTIFIES ‘SOURCES’ OF WASTE • SEE THE FUTURE • PLAN ACTION • change is easier if we understand why
Acknowledgements • “Lean Thinking” by James Womack and Daniel Jones • “Toyota Production System” by Taiichi Ohno • Simpler Business System, www.simpler.com