Download

1 / 44
440 likes | 791 Vues
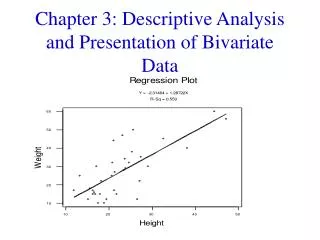
Investigating Bivariate Measurement Data using iNZight Statistics Teachers’ Day 22 November 2012 Ross Parsonage. New AS 3.9 versus Old AS 3.5. Much less emphasis on calculations More emphasis on: Visual aspects Linking statistical knowledge to the context Reasoning and reflecting Data:

E N D
Investigating Bivariate Measurement Data using iNZight • Statistics Teachers’ Day • 22 November 2012 • Ross Parsonage
New AS 3.9 versus Old AS 3.5 • Much less emphasis on calculations • More emphasis on: • Visual aspects • Linking statistical knowledge to the context • Reasoning and reflecting • Data: • 3.5 – collected or provided • 3.9 – using existing data sets • Use and interpretation of R2 is not expected
Alignment of Standards with NZC (2007) • One of the principles: • Grade distinctions should not be based on the candidate being required to acquire and retain more subject-specific knowledge.
Explanatory Note 2 (A) • Investigate bivariate measurement data involves • showing evidence of using each component of the statistical enquiry cycle.
Explanatory Note 2 (M) • Investigate bivariate measurement data, with justification involves • linking components of the statistical enquiry cycle to the context, and • referring to evidence such as statistics, data values, trends or features of data displaysin support of statements made.
Explanatory Note 2 (E) • Investigate bivariate measurement data, with statistical insight involves • integrating statistical and contextual knowledge throughout the investigation process, and may include • reflecting about the process; • considering other relevant variables; • evaluating the adequacy of any models, or showing a deeper understanding of the models.
Explanatory Note 4 • In regression analysis the y-variable, or response variable, must be a continuous variable. • The x-variable, or explanatory variable, can be either a discrete or continuous variable. • The relationship may be non-linear.
Using the statistical enquiry cycle to … • investigate bivariate measurement data involves: • posing an appropriate relationship question using a given multivariate data set • selecting and using appropriate displays • identifying features in data • finding an appropriate model • describing the nature and strength of the relationship and relating this to the context • using the model to make a prediction • communicating findings in a conclusion
Using the statistical enquiry cycle to … • investigate bivariate measurement data involves: • posing an appropriate relationship question using a given multivariate data set • selecting and using appropriate displays • identifying features in data • finding an appropriate model • describing the nature and strength of the relationship and relating this to the context • using the model to make a prediction • communicating findings in a conclusion
Posing relationship questions • Possibly the most important componentof the investigation • Time spent on this component can determine the overall quality of the investigation • This component provides an opportunity to show justification (M) and statistical insight (E)
Posing relationship questions • What makes a good relationship question? • It is written as a question. • It is written as a relationship question. • It can be answered with the data available. • The variables of interest are specified. • It is a question whose answer is useful or interesting. • The question is related to the purpose of the task. • Think about the population of interest. Can the results be extended to a wider population?
Developing question posing skills • Phase 1 • Introduce the data set and the variables • Students (groups/individually) consider the variables (using context) and think about which variables could be related (encourage reasoning and justification) • Pose several relationship questions (written with reasons/justifications) • Possibly critique the questions • The precise meaning of some variables may need to be researched
Developing question posing skills • Phase 2 • Students draw scatter plots to start to investigate their questions • Reduce, add to and/or prioritise their list of questions • Possibly critique the questions again
Developing question posing skills • Phase 3 • Give students an opportunity to do some research • Improve knowledge of variables and context • May find some related studies that creates potential for integration of statistical and contextual knowledge
Different relationship questions • Is there a relationship between variable 1 and variable 2 for Hector’s dolphins? • What is the nature of the relationship between variable 1 and variable 2 for athletes from the AIS? • Can a person’s variable 1 be used to predict their variable 2 for athletes from the AIS?
Using the statistical enquiry cycle to … • investigate bivariate measurement data involves: • posing an appropriate relationship question using a given multivariate data set • selecting and using appropriate displays • identifying features in data • finding an appropriate model • describing the nature and strength of the relationship and relating this to the context • using the model to make a prediction • communicating findings in a conclusion
Appropriate displays • Scatter plot – nothing else • Which variable goes on the x-axis and which goes on the y-axis? • It depends on the question and on the variables of interest • Is there a relationship between zygomatic width and rostrum length for Hector’s dolphins?
Variables on axes • Is there a relationship between zygomatic width and rostrum length for Hector’s dolphins?
Appropriate displays • Scatter plot – nothing else • Which variable goes on the x-axis and which goes on the y-axis? • It depends on the question and on the variables of interest • Is there a relationship between zygomatic width and rostrum length for Hector’s dolphins? • Is there a relationship between rostrum width at midlengthand rostrum width at base for Hector’s dolphins?
Variables on axes • Is there a relationship between rostrum width at midlength and rostrum width at the base for Hector’s dolphins?
Appropriate displays • Scatter plot – nothing else • Which variable goes on the x-axis and which goes on the y-axis? • It depends on the question and on the variables of interest • Is there a relationship between zygomatic width and rostrum length for Hector’s dolphins? • Is there a relationship between rostrum width at midlengthand rostrum width at the base for Hector’s dolphins? • For Hector’s dolphins, can rostrum length be used to predict mandible length?
Variables on axes • For Hector’s dolphins, can rostrum length be used to predict mandible length?
Appropriate displays • Scatter plot – nothing else • Which variable goes on the x-axis and which goes on the y-axis? • It depends on the question and on the variables of interest • Encourage students to write about their choice of placement of variables on the axes
Choosing variables for axes – activity • Possible activity • Introduce the data set and the variables • Students (groups) pose several questions to investigate • Students discuss whether or not it matters which variables go on each axis, and if it does matter, they make their selection
Using the statistical enquiry cycle to … • investigate bivariate measurement data involves: • posing an appropriate relationship question using a given multivariate data set • selecting and using appropriate displays • identifying features in data • finding an appropriate model • describing the nature and strength of the relationship and relating this to the context • using the model to make a prediction • communicating findings in a conclusion
Features, model, nature and strength • Generate the scatter plot
Features, model, nature and strength • Generatethe scatter plot • Let the data speak • Use your eyes (visual aspects) • Have a template for features (but allow flexibility) • Trend • Association (nature) • Strength (degree of scatter) • Groupings/clusters • Unusual observations • Other (e.g., variation in scatter)
Trend • From the scatter plot it appears that there is a linear trend between rostrum width at base and rostrum width at midlength. • This is a reasonable expectation because two different measures on the same body part of an animal could be in proportion to each other.
Association • The scatter plot also shows that as the rostrum width at base increases the rostrum width at midlengthtends to increase. • This is to be expected because dolphins with small rostrums would tend to have small values for rostrums widths at base and midlength and dolphins with large rostrums would tend to have large values for rostrums widths at base and midlength.
Find a model • Because the trend is linear I will fit a linear model to the data. • The line is a good model for the data because forall values of rostrum width at base, the number of points above the line are about the same as the number below it.
Strength • The points on the graph are reasonably close to the fitted line so the relationship between rostrum width at midlength and rostrum width at base is reasonably strong.
Unusual points • One dolphin, one of those with a rostrum width at base of 86mm, had a smaller rostrum width at midlengthcompared to dolphins with the same, or similar,rostrum widths at base.
Anything else • Variation in scatter?
Prediction • Using RWB = 85mm • All points: RWM = 0.77 x 85 – 8.72 = 56.73 • NI dolphins: RWM = 0.48 x 85 + 19.19 = 59.99 • SI dolphins: RWM = 0.46 x 85 + 14.37 = 53.47 Summary for Island = 1 Linear Trend RWM = 0.48 * RWB + 19.19 Summary for Island = 2 Linear Trend RWM = 0.46 * RWB + 14.37 Linear Trend RWM = 0.77 * RWB + -8.72
Communicating findings in a conclusion • Each component of the cycle must be communicated • The question(s) must be answered
Summary • Basic principles • Each component • Context • Visual aspects • Higher level considerations • Justify • Extend • Reflect
Other issues (if time) • The use or articles or reports to assist contextual understanding • How to develop understanding of outliers on a model • Should the least-squares process be discussed with students? • The place of residuals and residual plots • Is there a place for transforming variables?