Environmental Challenges: Understanding Systems and Sustainability
Explore the complexities of environmental problems and why solutions are elusive. Learn about systems' predictability, feedback loops, and the interplay of ecosystems for a sustainable future. Discover how societies impact, manage, and adapt to the environment.

Environmental Challenges: Understanding Systems and Sustainability
E N D
Presentation Transcript
SYSTEMS Why are Environmental Problems so Difficult to Solve? 3
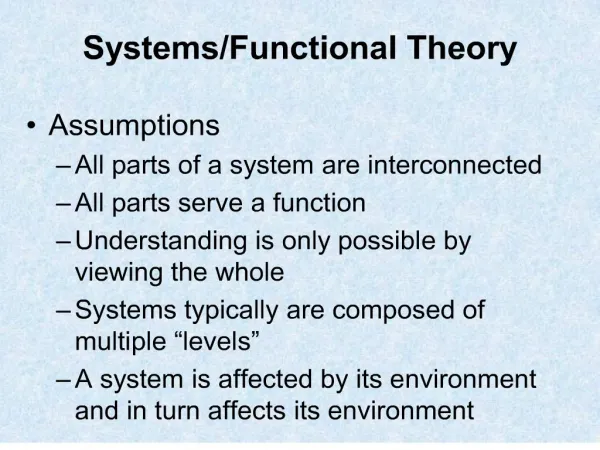
STUDENT LEARNING OUTCOMES After reading this chapter, students will be able to • Explain how systems are able to generate predictable behaviors and are able to display homeostasis. • Explain how natural selection traits allow organisms to thrive in particular environments. • Compare and contrast linear and non-linear growth and their effects on society’s ability to manage the environment. • Identify the characteristics of systems that make it difficult to solve environmental challenges and why potential solutions sometimes make the problem worse. • Explain how the scientific method is able to evaluate competing explanations for observable phenomena.
The Last Tree on Easter Island and the Lorax • Roggeen arrived on Easter Island in 1722, no trees or bushes higher than 3 meters present • Analysis of charcoal and pollen in mud cores indicated up to 21 species of trees were originally present. • Forest largely eliminated between 1400s and 1600s • How could the Easter Islanders have cut down the last of their trees? • Who Is the Lorax?
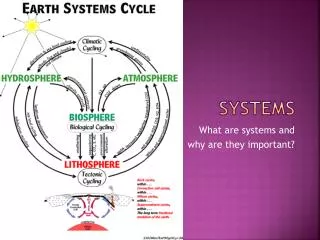
What are Systems? • A system is a collection of parts, which are known as storages and flows, that interact with each other to generate regular or predictable patterns or behaviors. clouds ocean
Do Systems Have Goals? • Defining characteristic of a system is its regularity or predictability • Environmental impacts are often determined by economic systems • The PURPOSE of an economic system is to produce and distribute goods and services that people associated with material well-being. • Economic behaviors are judged by efficiency, which refers to getting the most out of the resources used • Economic efficiency not equated with fairness • Economic changes produce winners and losers but that does not indicate whether the changes are economically good or bad.
Using Energy to Generate Order • Materials flow spontaneously from low entropy to high entropy resulting in gradients.
Spontaneous Flow Occurs without energy input From high concentration to low Non-Spontaneous Flow Requires energy input From low concentration to high At least one of these required in biogeochemical cycles Types of Flow
Homeostasis • The ability to maintain the behavior of a system when disturbed. • Measured by system’s ability to maintain a certain storage or flow, termed the set point. • For example, the temperature set point for the human body is 37 degrees Celsius.
Positive Relationship between system parts Increase in one part means increase in another Decrease in one part means decrease in another Symbolized with a Amplifies behavior GUITAR AMPLIFIER GLOBAL WARMING? Negative Relationship between system parts Increase in one part means a decrease in another Decrease in one part means increase in another Symbolized with a Balances behavior THERMOSTAT/FURNACE HUMAN BODY TEMP System Structure - + A complex, dynamic system (e.g. a living organism) consists of many positive and negative relationships
Analyzing Relationships • Function is a mathematical formula that relates one variable (dependent) to another variable (independent) • Independent variable is on the right hand side of the equal sign in a function and is represented by X-axis (horizontal) • Dependent variable is on the left hand side of the equal sign in a function and is represented by Y-axis (vertical) Agriculture Land = 0.8 * Population Dependent variable coefficient Dependent variable
- Forest Responds to Population
Feedback Loops The effects of a disturbance on a system can be evaluated using the notion of a feedback loop.
Why are Systems Difficult to Manage? • Why do societies behave unsustainably? • Unpredictability (stochastic behavior) • Variance is the degree or dispersion or scatter in a variable (large variance means low predictability) • Unpredictability and extreme events make it difficult to manage environmental systems • Risk Management (used without knowing all!) • Complexity • The number of storages, flows, and the number and strength of feedback loops in a system
Complexity in Easter Island System • Positive feedback loop that included human population, agricultural land, and food supply. • Negative feedback loop that included population, agricultural land, forest area, and supply. Not possible to know which of these loops predominates.
Hierarchy • Systems often are part of a larger system. • Subsystems arranged like a ladder according to function • Organization of natural world viewed as hierarchy of systems
Time Lags • Time lag refers to the period that lapses between a cause and an effect. • Long lag times make it difficult to establish cause and effect • Long lag times also diminish effectiveness of environmental policy
Distance Effects • Distance refers to the separation in space between a cause and an effect. • Effects of Acid Rain in the Appalachian Mountains and the tall stacks in the Mid-West.
Linear versus Non-Linear Relationships • Linear functions are represented with a straight line • Constancy disappears in nonlinear relationships, which are represented with a function other than a straight line. • Most of us tend to see the world through “linear glasses” • Nonlinear implies that the severity of an environmental problem can increase suddenly even if the cause of the problem increases gradually.
Reductionistic versus Systems • A Reductionist Approach is based on a premise that the best way to learn about something is to break it into its parts and study parts separately. • This approach has been quite successful in the natural sciences (biology, chemistry, physics) • Limits of the reductionist approach were first recognized by Frederick von Bertlanfy • General Systems Theory- concerned with problems of relationships, structures, and interdependence, rather than constant attributes of object. • Integrated Systems Approach
Simulation Models • Mathematical representations that simulate behavior of systems from insights gained from many disciplines • First, choose which storages and flows to include • Quantify the nature (positive or negative) and the strength (weak or strong) of the relationships. • Calibrate or validate the Model using real-world observations. • Scenario Analysis (“What if?”) • Use an existing such as SimCity, SimEarth, or build your own: STELLA