Download
1 / 6
60 likes | 158 Vues
This study investigates cell viability, mRNA ratios, gene expression intensities, data normalization, DNA sequences, and TF binding sites in adult stem cells. It also analyzes transcription factor networks during fetal and late fetal erythropoiesis.

E N D
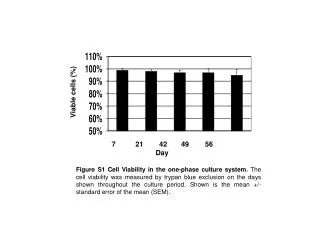
Viable cells (%) 7 21 42 49 56 Day Figure S1 Cell Viability in the one-phase culture system. The cell viability was measured by trypan blue exclusion on the days shown throughout the culture period. Shown is the mean +/- standard error of the mean (SEM).
* * • g/g+b(●) & b/g+b(■) mRNA Ratios * * 7 14 21 28 Days Figure S2 The γ/β-globin switch is observed in adult stem cells. RT-qPCR analysis was performed at the days shown to determine changes in γ-globin and β-globin mRNA levels after normalization by the internal control GAPDH.
14 12 10 8 6 4 Gene Expression Intensities 21 42 49 56 Days Figure S3 Data Normalization. The raw data obtained from the Illumina Beadstation were summarized as probe level signal intensities using Illumina BeadStudio v2.1.3, then background subtraction and quantile normalization were completed using the MBCB (Model-Based Background Correction for BeadArrays) algorithm.
LCR HBE NCR(γ) HBG2/HBG1 HBBP1 HBD NCR(β) HBB 37952 42835 64787 70545 1 22611 54027 81661 Input DNA sequences Figure S4 TESS/TFSEARCH analysis. To provide evidence for a role of the novel transcription factors (TF) in globin gene regulation, we performed in silico TESS and TFSEARCH analysis to locate predicted binding motifs in the β-locus using reference sequence NG_000007.3. The triangles above the schematic of the β-locus identifies the genomic sequences (numbers below the locus) investigated for predicted TF binding sites.
Figure S5 UCB-stem cells transcription factor network analysis. The MiMI plugin for Cytoscape was used to integrate data from multiple well-known protein interaction databases including KEGG and Reactome. The network analysis included Profile-1 transcription factors with significant change in expression during fetal erythropoiesis. A more detailed analysis is shown in Fig. 4C.
Figure S6 UCB-stem cells transcription factor network analysis. The MiMI plugin for Cytoscape was used to integrate data from multiple well-known protein interaction databases including KEGG and Reactome. The network analysis included Profile-2 transcription factors with significant change in expression during late fetal erythropoiesis. A more detailed analysis is shown in Fig. 4D.