Oxygen Transport Dynamics: Impact of P02 Changes
180 likes | 220 Vues
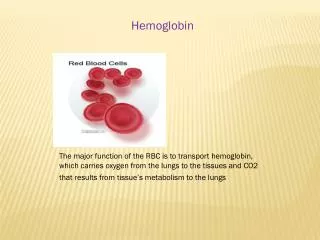
Explore the intricacies of oxygen transport dynamics, including the effects of various factors on hemoglobin saturation and oxygen content in the blood. Learn about the Bohr effect, oxygen dissociation curve, and the critical role of oxygen uptake by tissues. Dive into the complexities of oxygen transport in different tissues and the impact of hypoxia on cellular oxygenation.

Oxygen Transport Dynamics: Impact of P02 Changes
E N D
Presentation Transcript
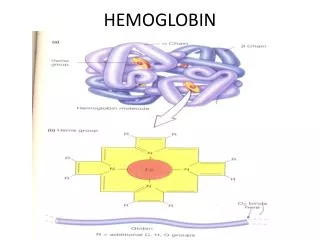
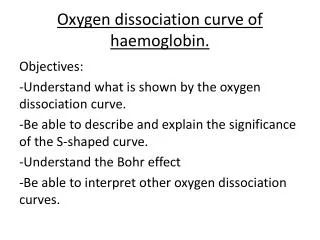
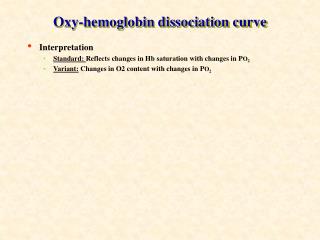
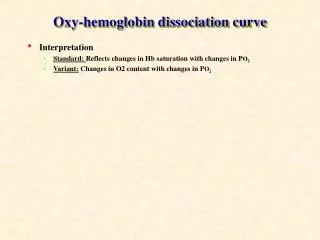
Interpretation Standard: Reflects changes in Hb saturation with changes in PO2 Variant: Changes in O2 content with changes in PO2 Oxy-hemoglobin dissociation curve
Interpretation Standard: Reflects changes in Hb saturation with changes in PO2 Variant: Changes in O2 content with changes in PO2 Dynamics Oxy-hemoglobin dissociation curve
¯Temp, CO2 , 2-3 DPG; pH (favors loading) 100 P50 P50 80 60 Temp, CO2 , 2-3 DPG; ¯pH (favors unloading) %Saturation 40 20 0 20 40 60 80 100 PO2 (mmHg) Oxygen Transport Bohr Effect
Interpretation Standard: Reflects changes in Hb saturation with changes in PO2 Variant: Changes in O2 content with changes in PO2 Dynamics Changes in position affect the tendency to load or unload oxygen: Bohr effect Oxy-hemoglobin dissociation curve
VO2 = D * A * (PcO2 - PtO2) L2 Volume rate transfer(oxygen) Oxygen Transport • Lung 0.5-1.0 microns • Skeletal Muscle 80 microns • Brain 40 microns distance (L) can usually be decreased by recruitment • Myocardium 12 microns (approximately one capillary per muscle cell)
At The Lung: • 70-80% of alveolar surface is covered by a single cell layer of red blood cells • Maximal capacity is ~200 ml blood • Normal blood volume in the capillaries is ~70 ml • Alveolar-hemoglobin distance is 0.5 to 1.0 µm • Capillaries cover several contiguous alveoli • capillaries travel ~600-800 µm before joining a venule • In a normal resting individual, it takes ~750 msec for an RBC to traverse a gas exchange section
Alveolar PO 2 100 Normal Abormal Grossly abnormal (mmHg) 50 Blood PO 2 2 PO 0 0 250 500 750 Transit Time (msec)
100 Alveolar PO 2 (mmHg) 50 2 PO Blood PO 2 0 0 250 500 750 How about if transit time is decreased??? Transit Time (msec)
Oxygen uptake by blood (at the lung) is normally considered perfusion-limited • The amount of oxygen taken up by blood at the lungs is normally limited only by the rate of blood flow • Oxygen uptake by tissue (from blood) is normally considered diffusion-limited • The amount of oxygen taken up by tissue from the blood is normallly limited by diffusion characteristics (partial pressure gradient, distance)
Oxygen Transport 100 PO2 50 0
R c PO2 Anoxic 100 50 0 Oxygen Transport Adequate Critical Inadequate
80 100 80 60 60 80 60 100 80 Oxygen Transport PO2 40
20 100 50 10 30 30 50 100 20 Lethal Corner Oxygen Transport PO2 0
100 80 60 Hb Saturation (%) 40 20 0 20 40 60 80 100 P (mmHg) O 2
100 100 70 50 70 80 100 PO2 0 40 70 70 40 100 10 60 Hb Saturation (%) 40 70 40 40 100 50 70 20 0 20 40 60 80 100 P (mmHg) O 2 Oxygen Transport No Bohr effect Bohr effect PO2 10
Interpretation Standard: Reflects changes in Hb saturation with changes in PO2 Variant: Changes in O2 content with changes in PO2 Dynamics Changes in position affect the tendency to load or unload oxygen: Bohr effect Changes in shape usually reflect chemical alteration of the molecule Methemoglobin Thalessemias Carbon monoxide Oxy-hemoglobin dissociation curve
SaO2 = 97 20 16 12 (ml O2 /dl blood) O2 Content SaO2 = 62 (CO Hb=35%) 8 4 0 20 40 60 80 100 PO2 (mmHg) Oxygen Transport
Hypoxia: Inadequate tissue oxygenation • At the lung: hypoxic hypoxia • At the blood: • Anemia (reduced # RBCs or Hb) • Carbon monoxide: left-shifted O2-Hb curve and decreased carrying capacity • Hypoxemia due to hemoglobin mutation (thalassemia) • Perfusion-related (stagnant hypoxia) • Tissue level • Metabolic disorders • Poisons • Cyanide: inhibits oxidative phosphorylation • Dinitrophenol: uncouples oxidative phosphorylation • Carbon monoxide (cytochrome binding): prevents electron transfer to oxygen