Statistical Applications in Quality and Productivity Management
310 likes | 551 Vues
Statistical Applications in Quality and Productivity Management. Sections 1 – 8. Skip 5. Introductory Notes. Quality is an important concept for effective competition in our global economy. Quality refers to both goods and services (good examples on page 752).

Statistical Applications in Quality and Productivity Management
E N D
Presentation Transcript
Statistical Applications in Quality and Productivity Management Sections 1 – 8. Skip 5.
Introductory Notes • Quality is an important concept for effective competition in our global economy. • Quality refers to both goods and services (good examples on page 752). • Some tools: control charts, Pareto diagrams, and histograms (and understanding of random variables).
18.1: Total Quality Management (TQM) • Global Marketplace • USA companies have been interested in quality since the middle to late 1950s. • The systematic approach to management that emphasizes quality and continuous improvement of products and services is called Total Quality Management. See page 753.
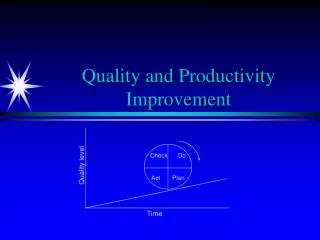
Deming’s 14 Points: A Theory of Management • Japan as a model. • Shewhart-Deming Cycle: Figure 18.1
18.2 Six Sigma Management • Quality improvement from Motorola 1980s. • Create processes that result in no more than 3.4 defects per million. • D—define • M—measure (the CTQ characteristics) • A—analyze (why defects occur) • I—improve (often with experiments) • C—Control (maintain benefits)
18.3: The Theory of Control Charts • Control chart shows the plot of data over time. • The data being plotted is related to quality. • The control chart gives insight into variability. • Use the control chart to improve the process. • Different types of data have different types of control chart.
Variation • To separate the special (assignable) causes of variation from chance (common causes). • Special causes of variation are correctable without changing the system. • Reducing variation from common causes requires that the system be changed (by management).
Control Limits • Typically calculate +/- 3 standard deviations of the measure of interest (mu, proportion, range, etc.). • Upper Control Limit (UCL) = process average plus 3 standard deviations. • Lower Control Limit (LCL) = process average minus 3 standard deviations. • A process that produces data outside of the control lines is said to be “out of control.”
Out of Control • First thing: identify sources of variation. • Hopefully we can find the assignable cause(s). • Figure 18.3, page 757: • Panel A: stable—in control • Panel B: special cause detected in 2 places • Panel C: not in control, in a trend • Define Trend, page 757.
In Control--Stable • Only common cause variation. • Is the common cause variation small enough to satisfy the buyers of the product? • Yes: monitor process. • No: change process.
18-4: Control Chart for the Proportion of Nonconforming Items—The p Chart • p chart is an attribute chart: shows the results of classifying sample observations as conforming or nonconforming. • The p chart shows the results, i.e. the proportion of nonconforming items in a sample.
Theory • p chart is based on binomial distribution. • Use formulae 18.2 and 18.3 to calculate the upper and lower control limits
Mechanics • Negative values of LCL mean that there is no LCL. • “Subgroup” means number of days that samples were taken. • The formulas work out nicer if the sample size is the same for each subgroup as is demonstrated in Table 18.1. • PHStat and Minitab will produce control charts.
Example 18.1 • Making sponges. • data: k=32 (the proportion was calculated 32 times). • The sample sizes were different for each sample. • Figure 18.6 and 18.7 • One instance of special cause variation. • Minitab calculates new control limits for each day.
18.5: The Red Bead Experiment: Understanding Process Variability • This experiment demonstrates some aspects of production and quality control. • In the experiment the “workers” must produce white beads. A red bead is nonconforming. • The “inspectors” count the red beads. • Production input is 80/20 white to red ratio. • Production tools are limited.
Lessons learned from the Experiment • Processes have variation. • Worker performance is primarily determined by the system. • Only managers can change the system. • Some workers will be above average and some will be below average.
18.6: Control Chart for an Area of Opportunity—The c Chart • Instead of looking at the proportion of nonconforming items, look at the number of nonconforming items per unit. • The “area of opportunity” is called a “unit.” • In considering the number of typos on a page, the page is the unit. • In considering the number of flaws in a square foot of carpet, the unit is the square foot of carpet.
Theory of the c Chart • The probability distribution is Poisson. • If the size of the unit remains constant, the normal probability distribution can be used to derive the formulae in 18.3. • In other words, the “3” in Formulae 18.3 is theoretically derived.
Example using Table 18.4 • Number of complaints per week for 50 weeks. • “Unit” = week. • k = 50. • c-bar = sum of complaints / 50. • LCL does not exist. • Figure 18.9: out of control due to trend. • Obvious managerial question is ___.
18.7: Control Charts for the Range and the Mean • Instead of measuring qualities such as “defective” or “Nonconforming,” we often want to measure quantities. • Variables control chartsare used with quantities. • Variables control charts are used in pairs: • one for variability: the range chart. • One for the process average: the x-bar chart.
The R Chart • Examine the Range chart first. • In control? Use it to develop mean chart. • Out of control? Use it to achieve control. Mean chart is not useful until in control. • Formulae 18.4 and 18.5 define the control limits. The constants are found in Table E.13. What do we need to know?
Example from Table 18.5 • How much time is required to move luggage from lobby to guest room? • Examine 5 deliveries per day for 28 days. • Calculate the average time per day and the daily range. • Examine R chart. In control?
The x-bar Chart • Formulae 18.6 and 18.7 show that you need x-bar-bar and the average range. • The “A” factors are found in Table E.13.
Figure 18.11 • The x-bar control chart for luggage delivery times. • In control? • Since the R-chart and X-bar-chart show processes that are “in control” if a change is desired, management must change the process.
18.8: Process Capability • Answers the question: can our process satisfy the quality requirements of our customers? • To answer this question, we must know: • what the customers expect. • that our process is in control.
3 Approaches to Capability • Process Capability is the ability of a process to consistently meet requirements. • Use the “specification limits” to calculate the probability of falling within specifications. • Calculate the Cp index. • Calculate the Cpk index.
Probability of Falling within Spec. • Process must be in control. • You will need x-bar-bar, R-bar, n, d2, and the customer specification limits. • Customer specification limits are called LSL and USL. • Need to assume that the population of measured values—the x values—is approximately normally distributed. • Use formulae 18.8.
The Cp Index • An “overall” measure of ability to meet specification. • Cp is the most common index used. • Formula 18.9. • Ratio of (1) distance between specification limits and (2) actual process spread. • Bigger is better; less than 1 is not good.
Problems with Cp • This index shows potential capability. Since it does not consider x-bar, the actual capability is in question. • Most optimistic assumption is that the process is operating near the center of the control area, i.e. near x-bar-bar. • Many companies require values near 2.0—very strict control!
The Cpk Index • Cpk = min [CPL, CPU] • CPL and CPU are capability indices that show the process capability relative to the actual operation of the process. • Formulae 18.10. • Bigger is better. • The minimum CP is the conservative value of process capability.