Urban structure
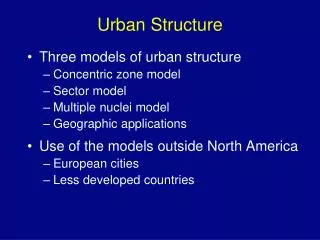
Urban structure . Distance-decay concepts. Internal structure of a city. land uses population density population characteristics (age structure, income, occupation, etc) physical appearance (height of buildings, traffic flow, etc). . Urban structure.

Urban structure
E N D
Presentation Transcript
Urban structure Distance-decay concepts
Internal structure of a city • land uses • population density • population characteristics (age structure, income, occupation, etc) • physical appearance (height of buildings, traffic flow, etc).
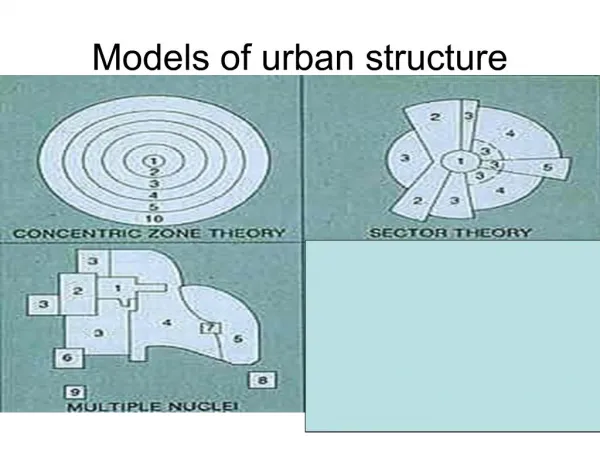
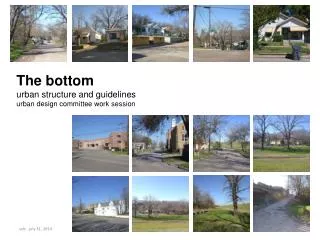
Urban structure • (Form & shape of a town) + (Arrangement & layout of its buildings) = urban morphology.
Land rent • = the return (profit, output) from the investment (input) in the land, which is based on superiority of location or level of accessibility / amenity.
Distance-decay • = the concept of declining intensity of any pattern or process with increasing distance from a given point or location. It suggests that the degree of spatial interaction is inversely related to distance, i.e. a negative correlation exists.
Bid-rent • = a function of accessibility which in turn is determined by the distance from a central point (e.g. city centre, road junction or route intersection). The farther away from the central point, the less is the rent (a person is willing to pay) and vice versa.
Bid-rent curve • indicates how much a person is prepared to pay for a unit of land at varying distances from the city centre (person = retailer, householder, farmer, etc) It describes the trade-off of cheaper land rents with increased transport costs due to increased distance from the city centre. Thus, it shows distance-decay effect and represents a series of rents to which a person is indifferent (i.e. he is equally satisfied at any point on the bid-rent curve.)
Why does land rent decline with increasing distance from the city centre? • declining accessibility with increasing distance away from the city centre • shortest land supply at the centre • land use competition • distance-decay effect • different rental capacity / bid-rent curves of different urban land uses
Land for different uses • competition for land • which is keen in a city centre as • the city centre is the most accessible location in the city • land is in its shortest supply at the centre
Peak land value intersection • Land is the most expensive • because competition is the keenest in the most accessible part of the city • because land here is the most scarce.
as the accessibility declines, the demand for land decreases away from the centre. • As the land supply becomes more plentiful, the bid-rent falls.