Understanding the Human Development Index: Key Factors and Global Disparities
The Human Development Index (HDI) is a composite measure of economic, social, and demographic factors influencing a nation's development. Key economic indicators include GDP and GDP per capita, highlighting disparities between More Developed Countries (MDCs) and Less Developed Countries (LDCs). Social factors encompass literacy rates and education levels, while demographic factors consider life expectancy. For instance, the U.S. GDP per capita was $45,600 in 2009, whereas LDCs often struggle with figures below $3,000. This analysis aims to shed light on the complexities of global development.

Understanding the Human Development Index: Key Factors and Global Disparities
E N D
Presentation Transcript
Human Development Index • HDI • Economic factor is gross domestic product per capita • Social factors are literacy rate and amount of education • Demographic factor is life expectancy
GDP • Total output of goods and services • GDP of the US was 14 trillion in 2009 • GDP per capita $45,600 • Most LDCs per capita is less than $3,000
Types of Jobs • Primary (agriculture) • Secondary (manufacturing) • Tertiary (services)
Primary • Extract materials directly from earth
Secondary Sector • Process, transform, and assemble raw materials into products • Tertiary sector- banking, law, education, and government
Consumer Goods • Transportation, communication, computers in MDCs • Motor vehicles provide individuals with access to jobs and services and permit business distribute their product. • Communication with raw materials providers and consumers • Computers share info from buyers to suppliers
Stats per 1000 • MCD • Telephone 800 • Motor vehicle 400 • Internet 400 • LCD • Tele 200 • Vehicle 20 • Internet 100
Education • Literacy rate- percentage of people who can read and write. • 98% MCDs vs less than 60% in LCDs • MCDs often have less students per teacher than LCDs • Less than 20 per elementary • More than 30
Life Expectancy • Males live 10yrs longer in MCDs • Females 13yrs longer • MCDs have a higher percentage of older people who have retired and receive public support. • In LDCs, number of young people is six times higher
Infant Mortality Rate • 94% of infants survive in LDCs • 99.5% in MDCs • Malnutrition, lack of medicine for illness • Babies may die from dehydration due to diarrhea • Bad medical practice due to lack of education
Crude Birth Rate • LCDs have higher natural increase than MCDs. • 23 per 1,000 in LCDs • 12 per 1,000 in MDCs • Why fewer babies in MCDs? • Economic reasons, social reasons, birth-control
Crude Death Rate • Does not affect a countries development • CDR is lower in LDCs 8 per 1,000 • MCD 10 per 1,000 • Why is the CDR lower in LDCs? • Diffusion of medical technology reducing several disease. Second, more elderly in MCDs
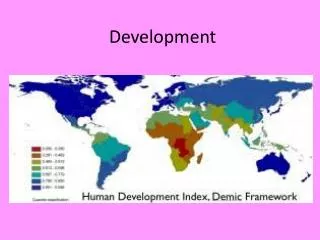
Regions (9) • North America, HDI .95 • Europe, HDI .93 • Latin America, .82 • East Asia, .77 • Southwest Asia (including North Africa), .74 • Southeastern Asia, .73 • Central Asia, .70 • South Asia .61 • Sub-Saharan Africa .51
North America .95 • Worlds leading food exporter with very few farmers, but a large percentage of the region workforce is involved in some aspect of producing or serving food. • Once leading manufacturer • N.A. financial institutions played a leading role in the deep recession. (Subprime loans)
Strengths and weakness • GDP per capita and literacy rate • Lower in education and life expectancy • Lower education due to high school drop outs • Lower education due to inadequate health care coverage
Europe .93 • 15 of the 19 highest HDI rankings • Eastern countries lag in development compared to the west. • International trade has been hit the hardest in Europe. Dependent on international trade. • Pay for imports with high value goods and services ex: BMW & Mercedes Benz
Less Developed Latin America .82 • Large cities are comparable with most MDCs. • Coastal area has a relatively high GDP per capita • Development in L. Am. is hindered by inequitable income distribution. Wealthy families control much of the land and rent parcels to tenant farmers
Grow coffee, tea, and fruits for export to relatively developed countries rather than domestic consumption. • L Am governments encourage redistribution of land to peasants • Economy closely linked to the US
East Asia .77 • China is the worlds largest market and manufacturer (shoes, microwaves, DVD players, steel, coal, cement, and more) • Severe recession has slowed China’s economic growth = declining demand for manufacturing goods
Communism in China • Government took control of most agricultural land. • Officials assigned specific tasks to farms and distributed food per family. • Weakness: • Middle management, quality control, banking, legal protection is inadequate
Southwest Asia and North Africa .74 • Dry desert • 70% of the worlds oil U.A.E., Saudi Arabia, and others • Large gap of GDP per capita from countries without oil reserves (Jordan, Egypt, Syria) • Islam 95% traditional values lead to lower development • inequalities among women. (literacy rate) • Conflicts with Iran & Iraq • Israeli Palestinian conflict
Southwest Asia .73 • Indonesia, Vietnam, and Thailand • Tropical climate limits intensive cultivation, poor soil • Frequent typhoons, tsunamis, active volcanoes keep population growth low • Continuous warfare colonies: Japan, French preventing Communism
Major manufacture of textiles, cloths, • Exporter of natural rubber, palm oil and coconut oil)
Central Asia .70 • Higher development in in Kazakhstan and Iran due to oil. • Iran has used oil profit to maintain low consumer costs rather than to promote development. • Shiite leaders have also used oil revenues to promote revolutions to sweep away elements of U.S. and European development and social customs.
South Asia • India, Pakistan, Sri Lanka, Nepal, and Bhutan • Principal beneficiary of the Green revolution “miracle rice” and wheat seeds • India is the fourth largest economy behind the U.S. China, and Japan • Leading producer of peanuts, sugarcane, tea • Resources: aluminum ore • Major manufacturer
Sub-Saharan Africa .51 • Minerals chromium, diamonds, diamonds, platinum • Poor health, low education levels, deteriorated economic conditions, European colonialism • Landlocked states have difficulties shipping out raw materials
Political problems • States created without regard to for the distribution of ethnicities. • Leaders pursued personal economic gain and local wars rather than policies to promote economic gain. • Africa has either a dry or tropical climate • Highest population growth rate= land overworked and agriculture output had declined.
How GDI is determined? • Economic- per capita female income to male • Social- number of females enrolled in school vs. males • Demographic- life expectancy of females compared to males • A low GDI means women have a low level of development and is substantially lower than men.
Gender Empowerment • The GEM measures the ability to imporve their status • Economic and political power
Economic • Per capita of females vs. males • Percentage of professionals and technical jobs held by women
Political • Percentage of administrative jobs held by women and percentage of members of the national parliament who are women. • Countries with the highest GEMs are MCDs (North America, North Europe, and Oceania) • Lowest in Africa and Asia
Development through Self-Sufficiency • China and India • Spread investment as equally as possible across all sectors of its economy and regions. • Pace of development is modest, but equal for all residents (country and city) • Limit imports to protect native business. (tariffs) restrict exports
In India • Foreign companies needed a license • Restricted the quantity it could sell in India • Heavy taxes on imported goods • Indian companies discouraged from exporting goods.