Exploring Quadratic and Cubic Functions: Graphing and Solving Equations
Learn about quadratic and cubic functions, drawing their graphs, plotting points, finding roots, and solving equations graphically. Discover step-by-step methods to understand and visualize mathematical concepts.


Exploring Quadratic and Cubic Functions: Graphing and Solving Equations
E N D
Presentation Transcript
Curves Dr Duxbury
Quadratic graphs In a quadratic function, the highest power of x is 2 and it is of the form y = ax2 + bx + c. Are the following quadratic functions?
Cubic graphs In a cubic function, the highest power of x is 3 and it is of the form y = ax3 + bx2 + cx + d. Are the following cubic functions?
Drawing a quadratic graph Plot the following quadratic function: What do we do first?
Drawing a quadratic graph II Checking your graph looks right:
Graphical Solution of Equations Solve Let Then find the values of x where the curve cuts the x-axis (that is where y=0).
Graphical Solution of Equations If we were to solve this equation without using a graph, then we could factorise the equation: To solve it graphically:
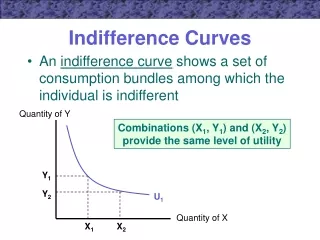
y The roots of a quadratic equation Solve x2 + 2x – 3 = 0 x = -3 x = 1
The roots of an equation This tells us that the solution to the equation is
y The roots of a quadratic equation Solve x2 + 2x – 3 = -2 So x = -2.5 and 0.5 x = 0.5 x = -2.5 y = -2
Exercise: Plot the graph of y = x2 +3x – 4 for values of x between –5 and 2 Use your graph to find values of x such that x2 +3x – 4 = 0, x2 +3x – 4 = -4 and x2 +3x – 4 = x
Solution y = 0
Solution y = -4
Solution y = x