
Infection Dynamics in Plants Post-Inoculation: An Analysis of Disease Spread Over Time
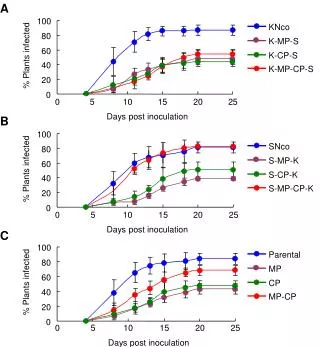
This study investigates the infection rates of various plant groups over a period post-inoculation with different viral strains. We observe the percentage of infected plants at 0, 5, 10, 15, 20, and 25 days after inoculation, focusing on the variations among groups such as B, C, and different parental lines. The findings reveal significant differences in infection dynamics, which are crucial for understanding pathogen spread and developing effective disease management strategies.

Infection Dynamics in Plants Post-Inoculation: An Analysis of Disease Spread Over Time
E N D
Presentation Transcript
KNco A K-MP-S 100 K-CP-S K-MP-CP-S 80 60 % Plants infected 40 20 0 0 5 10 15 20 25 Days post inoculation B 100 SNco 80 S-MP-K 60 % Plants infected S-CP-K 40 S-MP-CP-K 20 0 0 5 10 15 20 25 Days post inoculation C 100 80 60 % Plants infected Parental 40 MP 20 CP 0 0 5 10 15 20 25 MP-CP Days post inoculation


