Download
1 / 39
390 likes | 502 Vues
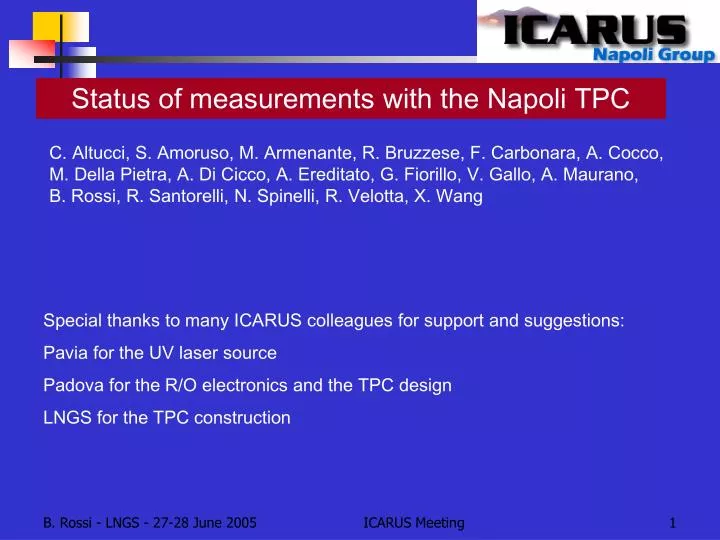
Status of measurements with the Napoli TPC. C. Altucci, S. Amoruso, M. Armenante, R. Bruzzese, F. Carbonara, A. Cocco, M. Della Pietra, A. Di Cicco, A. Ereditato, G. Fiorillo, V. Gallo, A. Maurano, B. Rossi, R. Santorelli, N. Spinelli, R. Velotta, X. Wang.

E N D
Status of measurements with the Napoli TPC C. Altucci, S. Amoruso, M. Armenante, R. Bruzzese, F. Carbonara, A. Cocco, M. Della Pietra, A. Di Cicco, A. Ereditato, G. Fiorillo, V. Gallo, A. Maurano, B. Rossi, R. Santorelli, N. Spinelli, R. Velotta, X. Wang Special thanks to many ICARUS colleagues for support and suggestions: Pavia for the UV laser source Padova for the R/O electronics and the TPC design LNGS for the TPC construction ICARUS Meeting
Content • Description of the TPC • Firsts events detected with theTPC prototype: cosmic events and laser tracks • Laser data analysis • Measurement of ionization vs laser energy • Results and next goals ICARUS Meeting
Napoli setup ICARUS Meeting
Napoli Laboratory Electronic Rack HV cable Mirror Oxysorb filter Flange Signal cable Twisted-pair Fill in Dewar GAr Cooling system cable Dewar ICARUS Meeting
“I” variable connector Pressure meter HV feedthrough Vacuum system Valve Membrane pump ICARUS Meeting
Criogenic lines with external tanks ICARUS Meeting
2nd floor for recirculation system ICARUS Meeting
Recirculation system dewar E-valve GAr in Safey valve LAr in Dewar ICARUS Meeting
HV Welding Screw Connection with HV ICARUS Meeting
TPC and Electric fields Cathode Vetronite Flange HV feedthrough Race tracks Level meter Signal cables Electric fields to have two induction planes con Vertical frame r=wire radius (75mm), p=pitch (3mm) E1 = 500V/cm E2 = 750V/cm E3 = 1125V/cm • Wire plane Shield = 98% • Trasparency = 87% Orizonthal frame Mirrors ICARUS Meeting
TPC configuration Two anodic wire planes (Ind1 & Ind2). 96 wires per plane. Ind2 is parallel to the laser beam ionization. Ind1 output is a signal only from a few number (<4) of wires positioned in the center of the plane. Mid wire is #48. Ind1 is orthogonal to the laser beam ionization. Its output must be the same signal at the same time from all 96 wires of the plane E3= 1125 V/cm Anode: – 1063 V Ind 2: – 725 V E2= 750 V/cm Ind 1: – 500 V @275 samples 30 cm 13 cm - - - - - - - - - - + + + + + 17 cm E1= 500 V/cm 1 cm = 25 samples Cathode: – 14500 V ICARUS Meeting
Cosmic event gallery ICARUS Meeting
Cosmic track Setting Npre = 200 Run 550 Event 00002 22 june 2005 h. 16:15.42 E.F. = 500 V/m Vdrift=1.56mm/ms Sample = 400 ns Induction 1 wiev Induction 2 wiev ID wire ID wire 125 125 100 100 75 75 50 50 25 25 200 400 600 800 1000 200 400 600 800 1000 Drift time(Samples=400ns) Drift time(Samples=400ns) ICARUS Meeting
Cosmic track Run 550 Event 00007 22 june 2005 h. 18:39.46 E.F. = 500 V/m Vdrift=1.56mm/ms Sample = 400 ns ID wire ID wire Induction 2 wiev Induction 1 wiev 100 100 Detected with LTCU trigger 75 75 50 50 25 25 Drift time (Samples=400ns) Drift time (Samples=400ns) Wire 80 200 400 600 800 1000 200 400 600 800 1000 Wire 45 ADC count (mV) ADC count (mV) 50 100 150 200 100 150 200 ICARUS Meeting
Cosmic track Run 550 Event 00007 22 june 2005 h. 18:39.46 E.F. = 500 V/m Vdrift=1.56mm/ms Sample = 400 ns ID wire ID wire Induction 2 wiev Induction 1 wiev 100 100 75 75 50 50 25 25 Drift time (Samples=400ns) Drift time (Samples=400ns) 200 400 600 800 1000 200 400 600 800 1000 Wire 70 Wire 44 Wire 45 ADC count (mV) ADC count (mV) 100 125 150 175 200 225 75 100 125 150 175 200 225 ICARUS Meeting
Cosmic track Run 550 Event 00007 22 june 2005 h. 18:39.46 E.F. = 500 V/m Vdrift=1.56mm/ms Sample = 400 ns ID wire ID wire Induction 2 wiev Induction 1 wiev 100 100 75 75 50 50 25 25 Drift time (Samples=400ns) Drift time (Samples=400ns) 200 400 600 800 1000 200 400 600 800 1000 Wire 72 Wire 59 Wire 45 50 100 150 200 ADC count (mV) ADC count (mV) 100 150 200 250 ICARUS Meeting
Cosmic track Run 550 Event 00007 22 april 2005 h. 18:39.46 E.F. = 500 V/m Vdrift=1.56mm/ms Sample = 400 ns ID wire ID wire Induction 2 wiev Induction 1 wiev 100 100 75 75 50 50 25 25 Drift time (Samples=400ns) Drift time (Samples=400ns) 200 400 600 800 1000 200 400 600 800 1000 Wire 43 Wire 62 ADC count (mV) ADC count (mV) 50 100 150 50 75 100 125 150 ICARUS Meeting
Shower Run 550 Event 00007 22 june 2005 h. 18:39.46 E.F. = 500 V/m Vdrift=1.56mm/ms Sample = 400 ns ID wire ID wire Induction 2 wiev Induction 1 wiev 100 100 75 75 50 50 25 25 Drift time (Samples=400ns) Drift time (Samples=400ns) 200 400 600 800 1000 Wire 45 200 400 600 800 1000 Wire 92 ADC count (mV) 50 100 150 200 250 300 50 100 150 200 250 300 ADC count (mV) ICARUS Meeting
Shower Run 550 Event 00007 22 june 2005 h. 18:39.46 E.F. = 500 V/m Vdrift=1.56mm/ms Sample = 400 ns ID wire ID wire Induction 2 wiev Induction 1 wiev 100 100 75 75 50 50 25 25 Drift time (Samples=400ns) Drift time (Samples=400ns) 200 400 600 800 1000 200 400 600 800 1000 Wire 43 Wire 50 ADC count (mV) ADC count (mV) 100 200 300 400 100 200 300 400 ICARUS Meeting
UV-LASER DAQ ICARUS Meeting
Laser DAQ trigger The Trigger pulse is the output signal of the lasers’ photodiode (in this case > 5V). This pulse is converted to a NIM signal and then is sent to the DAQ rack. The DAQ rate is 1 Hz. Daedalus setting Npre = 200 13 cm of drift At 1.3mm/ms Are 270 samples We wait the track At 470-480 sample ADC Buffer NIM signal e- drift Trigger pulse -800 mV 100 ns samples 1024 200 475 0 128 ms 410 ms ICARUS Meeting
Laser event Run 467 Event 00037 19 june 2005 h. 18:40.02 E.F. = (500/750/1100)V/cm Vdrift=1.34mm/ms Sample = 400 ns ID wire ID wire Induction 1 wiev Induction 2 wiev 100 100 Npre = 200 is the sample in which arrives the trigger signal 150 mm 75 75 50 320 mm 50 Wire #1 Is the nearest To the laser beam input 25 25 Drift time (Samples=400ns) Drift time (Samples=400ns) 200 400 600 800 1000 200 400 600 800 1000 ADC count (mV) ADC count (mV) Wire 38 Wire 48 350 375 400 425 450 475 375 400 425 450 475 ICARUS Meeting
Laser event Run 467 Event 00037 19 april 2005 h. 18:40.02 E.F. = 500 V/m Vdrift=1.34mm/ms Sample = 400 ns Induction 1 wiev Induction 2 wiev ID wire ID wire 100 100 75 75 50 50 25 25 Drift time (Samples=400ns) Drift time (Samples=400ns) 200 400 600 800 1000 200 400 600 800 1000 ADC count (mV) ADC count (mV) Wire 48 Wire 25 350 400 450 375 400 425 450 475 ICARUS Meeting
Laser event Run 467 Event 00037 19 april 2005 h. 18:40.02 E.F. = 500 V/m Vdrift=1.56mm/ms Sample = 400 ns Induction 1 wiev Induction 2 wiev ID wire ID wire 100 100 The induction 1 signal is too big and Induces a signal on the Other plane 75 75 50 50 25 25 Drift time (Samples=400ns) Drift time (Samples=400ns) 200 400 600 800 1000 200 400 600 800 1000 ADC count (mV) ADC count (mV) Wire 48 Wire 24 350 375 400 425 450 475 375 400 425 450 475 ICARUS Meeting
Laser event Run 467 Event 00037 19 april 2005 h. 18:40.02 E.F. = 500 V/m Vdrift=1.56mm/ms Sample = 400 ns Induction 1 wiev Induction 2 wiev ID wire ID wire 100 100 75 75 50 50 25 25 Drift time (Samples=400ns) Drift time (Samples=400ns) 200 400 600 800 1000 200 400 600 800 1000 ADC count (mV) ADC count (mV) Wire 48 Wire 25 350 400 450 300 350 400 450 500 ICARUS Meeting
LAr IONIZATION MEASUREMENT ICARUS Meeting
Liquid phase produces a shift of the energetic levels • Liquid ionization potential is lower than the gaseous one due to three effects: • the gain of a polarization energy for a positive ion immersed in a liquid (Born’s formula) • Broadening of the energetic levels for the creation of different valence levels (that is due to the condensation but is negligible for not polar molecules) • Lowering of the conductions levels Can be measured with the variation of the threshold of the photoelectric effect observed at the solid-liquid interface Born’s formula Fl extraction potenzial in liquid For Argon R = 0.88Å r = 1.5 Fv extraction potenzial in vacuum V0 energetic shift of the liquid phase Ar V0=-0.2 eV P+ = -1.57 eV ICARUS Meeting
This two effects lead a reduction of LAr ionization potential of Eval molto piccola per interazioni Van der Vaals DE=P++V0+Eval-1.76 eV We believe that this can be a three photon process Stark shift and broadening 0.62 eV resonance ICARUS Meeting
Sun et al. results Their model leads to a Cross section 10 order bigger than a normal 2 photon process There’s a close relaction between the slope of the fit data and the order of the process Classical formula ICARUS Meeting
Our preliminary measurements To have a rough estimate of the LAr ionization yield and a quick analisys we have only considered the signal induced by the the laser beam on the second TPC wire plane. Every laser source has an instability in energy. In our case the instability is about 5% (data sheet) To solve this problem We’ve used a photodiode to have a relative measurement of the single spot laser energy. The laser beam induces a signal usually on one wire (<3) because it is parallel to the light beam E.F. = (+500/+750/-500)V/cm The photodiode needs a calibration since one measures only a few % of the single spot laser energy. With this E.F. we have that All the electrons are collected on the second wire plane ICARUS Meeting
Joule meter Sensor PRISM Photodiode calibration Photodiode Output We’ve measured the peak output of the photodiode by varying the laser energy in the range 0.15 - 1.75 mJ and measuring this energy with a digital Joulemeter ICARUS Meeting
Photodiode calibration Photodiode output (mV) Y= 50.04 x + 18.48 Energy (mJ) ICARUS Meeting
LAr ionization vs laser energy Power of 3 3 g process Y= 0.0031x3.0 Area (a.u.) Very Preliminary Energy (u.a.) Photodiode output (mJ) ICARUS Meeting
Summary • Results: • cosmic events detected with the LTCU trigger • UV-laser induced tracks measured • Preliminary results on ionization yield vs laser Energy • Next goals: • improve data taking (noise) conditions • compare our (near future) results with those of Sun et al. • study the ionization process in a wider energy range • data analysis of the ind1 laser tracks • measurement of the cross section of the ionization process ICARUS Meeting