Download
1 / 20
220 likes | 390 Vues
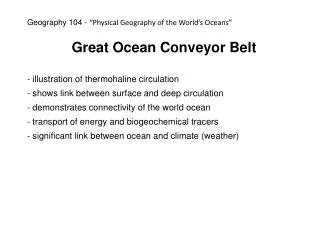
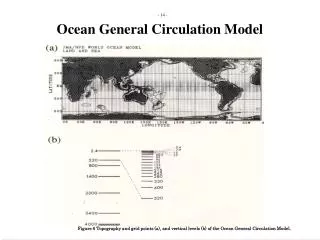
ocean circulation thermohaline conceptual model. REVIEW Wind - driven surface circulation. Earth’s Atmospheric Circulation.

E N D
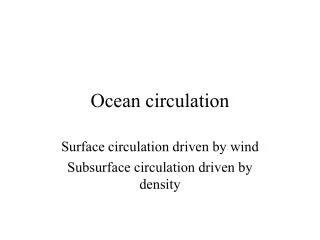
REVIEW Wind-driven surface circulation
For the North Pacific, be sure you know the correlations in the northern hemisphere between the Polar Easterlies, the Westerlies, and the Northeast Trade Winds, the spin these winds apply to the subtropical and subpolar gyres, the resulting surface currents, the Ekman transports and the convergence or divergence of each gyre.
… all the models we use in 251 explain ocean circulation that is steady … What does steady imply ? For us, that means there is no change in time allowed for the currents or the forces that cause the currents. And what does this mean ? The directions and strength of the current flow can change from geographic location to location since the forces are allowed to change from place to place. Therefore we can have a strong current like the western boundary Gulf Stream represented in our model at the same time the model can show the Canary Current, a broad and relatively slow flow regime.
Ekman’s Model the ocean’s response to a constant wind
Ekman current model focus response of the ocean to the drag of a constant speed wind at the atmosphere / ocean interface ocean environment infinite horizontal and vertical extent forces balanced horizontal wind stress coriolis current pattern [in the northern hemisphere] surface flow 45 degrees to the right of the wind flow decreases in speed with depth in a spiral to the right Implications water transport 90 degrees to the right over a wind-speed-dependent depth interval defined by current flow opposite to the surface flow.
Ekman model results Note the balance of Ekman’s two-force-model shown on the upper left. The projection of the flow vectors on the base is done to outline the Ekman spiral.
These are two schematic indications of how Ekman’s model can show part of the wind-induced flow pattern on continental shelves adjacent to a shoreline. Check out the real stuff along the US west coast via satellite infrared imagery on the next slide.
Here is a satellite image of Ekman at work … The blue upwelling regime along the CalIfornia coast is generated by strong s’west winds. … The blue are cold and nutrient rich waters that become entrained as part of the California Current, the boundary current on the eastern periphery of the central North Pacific sub-tropical gyre. Take your wet suit to the West Coast, the waters are colder than Galveston’s most of the time, like they are off Swami Beach at Encinitas … wave sets are much better too. ….
Thermohaline Circulation In the following slides, take notice of how the vertical distribution of water masses and subsurface flow has an interleaved structure. As well, there are increasing densities with depth and movements in opposing directions. Important : The sources of the water masses are at the ocean surface in regions of climatic extremes. Their vertical pattern is a function of the density of each water mass which increases steadily with depth. Slide 16 presents two vertical sections through the Atlantic Ocean from sixty degrees north [south of Iceland] to eighty degrees south [Antarctica]. The upper image is shows water temperature and the bottom image gives the distribution of dissolved oxygen. Find the Mediterranean water that has the lowest oxygen content and the North Atlantic Deep water that has a relatively high value. Why is there a difference?
Sinking of waters during thermohaline flow takes place along what is known as isopycnal surfaces. That is, along constant three-dimensional density surfaces. This illustration shows a section thru such a flow field. The salinity and temperature values pertinent to a given density are imposed on each contour line. Take this section as one along a south-to-north [left to right] longitude in the southern ocean. Note that the vertical distribution of temperature and salinity at the latitude of A mimics the horizontal distribution of temperature and salinity along the surface in the water mass’ source region. Along the surface labeled [35.6,10], water sinks down and to the right until it continues in horizontal flow at a depth where its density value is the same as other waters of similar density.
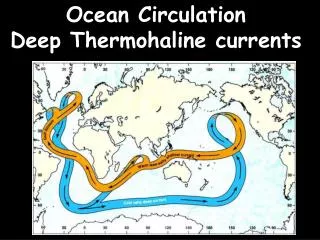
Follow the indicated movement of North Atlantic Deep Water [NADW] from the left of the illustration in the vicinity of the Norwegian Sea. Flow is south, over the sill at the Denmark Strait, and then downward until the NADW moves across the latitude of the equator and then rises toward Antarctica, displaced by Antarctic Bottom Water [ABW], and reaches the surface at 60 degrees S, where its flow turns north and south. The northward part now is known as Antarctic Intermediate Water [AIW] while the water of the southern movement, toward the continent, becomes even more dense and sinks toward the bottom, known hereafter as [ABW]. This is the most dense water in the world’s oceans. Can you explain why the AIW moves northward ? Why does it sink below the surface ?
This illustration shows averaged vertical density distribution broadly corresponding to the water masses shown in the previous slide.
SUMMARY Water Masses have been identified by oceanographers in terms of their joint salinity and temperature values, or by their dissolved oxygen concentration, or even by the presence of a specific biological entity. In what we call thermohaline circulation, irrespective of what depth such waters are found, the characteristic temperature and salinity have been determined by processes that bring about [heating and cooling] or [evaporation and dilution] at the ocean surface in geographic regions of climatic extremes. The very dense and therefore deepest waters are formed where surface conditions cause them to become very cold and saline [example: the Norwegian Sea]. Near the surface, warmer and more saline waters can be formed in areas wherein evaporation exceeds precipitation [example : the central North Pacific] Water masses do not readily mix when brought together but instead will flow above or beneath one another, distributing themselves vertically according to their density. Limited vertical mixing at interfaces between layers does occur, creating mixtures there. However, the central cores of water masses persist over long distances and times while moving at exceeding slow horizontal speeds relative to wind-driven surface currents. Over vast expanses in temperate and tropical climates there is a gradual rising induced by surface evaporation that returns water to the surface region. In addition, upwelling regions contribute by bringing waters to the surface.