Download
1 / 64
660 likes | 724 Vues
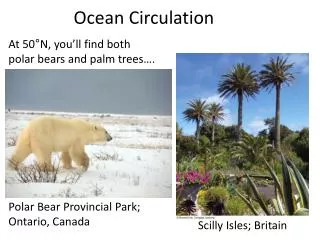
Explore the factors influencing seawater density like temperature, salinity levels, and evolution over time leading to variations in salinity in oceans and seas globally. Learn about how ice formation and layering contribute to changes in water density.

E N D
The Great Ocean Conveyor:Thermohaline Circulation Spring 2012, Lecture 11
Seawater Density • The density of seawater depends primarily on two factors • Temperature • Cold water is denser than warm water • Salt content (salinity) • The more salt that is dissolved in seawater, the denser it is
Temperature Variation • The temperature of the world's ocean is variable over the surface of the ocean • Temperature ranges from less than 0°C (32°F) near the poles to nearly 30°C (84°F) in the tropics • Seawater is heated from the surface downward by sunlight • At depth, most of the ocean is cold • 75% of the water in the ocean falls within the temperature range of −1 to +6°C (30 to 43°F)
Salinity • The amount of salts dissolved in water is called salinity • Salinity is measured in g per 1000 ml and a special symbol is used: ‰ by weight. • ‰ is read “parts per thousand”, or more commonly as parts per mille • Open ocean water has an average salinity of about 35 0/00 (equivalent to 3.5%) • 75 percent of the water in the ocean falls within the salinity range of 34 to 35‰ • Scientists use metric measurements and express quantities of dissolved substances as grams per liter, or 1000 milliliters • Thus, we use parts per thousand to express salinity
Salinity Variation • Red Sea = 40‰ • Mediterranean Sea = 38‰ • Average Seawater = 34.7‰ • Black Sea = 18‰ • Baltic Sea = 8‰
Evolution of a Salty Ocean • The salinity of the ocean has evolved over time • Early in earth’s history, the oceans were fresh water • As the result of water circulation within the hydrolgic cycle, rainwater falling on land dissolves minute amounts of salt, and carries it slowly to the ocean • When ocean water evaporates, it leaves salt behind, gradually increasing the salinity of the ocean • Until the solubility limit of some substance dissolved in the ocean is reached, this process continues to operate
Brackish Water • As water enters the sea, it mixes with salt water from the ocean • Much of this mixing occurs in estuaries, such as Chesapeake and San Francisco Bays • Water in estuaries is brackish, meaning it has a salinity between fresh water and open ocean seawater
Baltic Sea • Baltic Sea is a brackish inland sea • Surface discharge is 940 km3/yr • Sub-surface flow is 475 km3/yr • Streams contribute 660 km3/yr • The inflowing salt water stays deep, beneath a halocline • The halocline is a density induced barrier between the surface and deep waters • Little mixing occurs between so the surface and deep waters, so the salinity of the surface waters is 8‰
Black Sea • The Black Sea has a net positive outflow of about 300 km3/yr • There is a return flow of denser, saline water from the Aegean Sea, a part of the Mediterranean Sea • This accounts for the observed 18‰ salinity
Mediterranean Sea • The Mediterranean is a nearly land-locked sea, whose connection to the Atlantic Ocean • is only 14 kilometers wide • Evaporation greatly exceeds precipitation and river runoff in the Mediterranean • In the eastern half, evaporation is especially high • This creates a pressure gradient, which pushes low-salinity water from the Atlantic across the basin • This water warms, and salinity increases, due to evaporation • The water sinks and returns westward as a sub-surface flow, where it enters the Atlantic through the Strait of Gibraltar • The net salinity is higher than the open ocean at 38‰
Red Sea • The Red Sea is an inlet of the Indian Ocean, and is one of the most saline bodies of water in the world • It is bounded by arid lands, except for an opening to the Arabian Sea through the Gulf of Aden • Salinities range from 36‰ in the south to 41‰ in the north, with an average of about 40‰ • The high salinity is the result of extreme evaporation rates, as much as 205 cm/yr, coupled with very little freshwater input, from an annual rainfall of about 6 cm • The Red Sea was formed by Arabia pulling away from Africa • It is part of the Great Rift Valley system of East Africa
Causes of Salinity Variations • We have seen that salinity is affected by evaporation, and by mixing of fresh water with seawater • It is also affected by the formation of ice • As ice forms in salt water, there is no room in the crystal for salt • Salt is squeezed out of the ice structure and the resulting ice is less salty than when it began to freeze • In the polar regions, where seawater freezes to form sea ice, the ice is not as salty as the seawater from which it formed
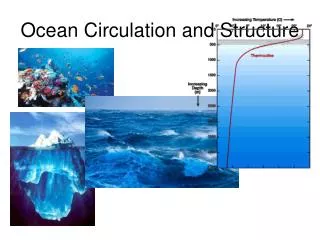
Layering in Water • Layers of differing densities can develop in water • If the density difference is primarily due to temperature, the boundary between layers is known as a thermocline • If the density difference is primarily due to salinity, the boundary between layers is known as a halocline
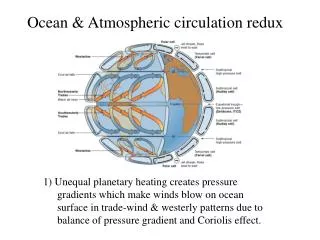
Circulation in the Ocean • Currents develop in the ocean for three reason: • Tidal forces – due to gravitational interactions between earth, the moon, the sun, and other planetary bodies in the solar system • Wind – due to pressure differences within the atmosphere • Density differences – due to seawater density differences caused by differences in temperature, salinity, or a combination of both
Thermohaline Circulation • Density driven currents form many of the main circulation patterns in the ocean • The following slides use images and text from Climatic Research Unit, School of Environmental Sciences, University of East Anglia, UK
The Gulf Stream (and its extension, the North Atlantic Drift) bring warm, salty water to the NE Atlantic, warming western Europe Gulf Stream • One of the water sources for the waters of the Gulf Stream is water leaving the Mediterranean Sea through the Strait of Gibraltar at 38‰ • This increases the initial salinity of water in the Gulf Stream
The water cools, mixes with cold water coming from the Arctic Ocean, and becomes so dense that it sinks, both to the south and east of Greenland Mixing with Cold Arctic Water • Note that red indicates surface flow, while blue indicates sinking or deep water flow
If we zoom out, we see that this current is part of a larger system, connecting the North Atlantic... ...the tropical Atlantic... Atlantic Ocean
Indian and Pacific Oceans • the South Atlantic... • ...the Indian and Pacific Oceans
Below the Surface • If we look below the surface, water from the two main sinking regions spreads out in the subsurface ocean... • ...affecting almost all the world's oceans at depths from 1000m and below... • Note the sinking of waters off Antarctica
Global Thermohaline Conveyor Belt • The cold, dense water gradually warms and returns to the surface, throughout the world's oceans • The surface and subsurface currents, the sinking regions, and the return of water to the surface form a closed loop, the thermohaline circulation or global thermohaline conveyor belt
Gulf Stream Evaporation • Waters in the Gulf Stream are very warm, and a great deal of water evaporates on the way to the North Atlantic • Together with the initially high salinity of this water, this makes the water much more saline, and thus denser • Therefore, the critical part of the thermohaline circulation (THC) is the sinking in the North Atlantic Ocean, not in the North Pacific • This makes the THC appear to be self-sustaining
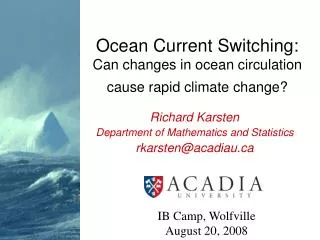
Breakdown of THC • If some event occurs to break this self-sustaining chain of processes, then there is the potential for the circulation to break down rapidly (i.e., over several decades) and to remain in a reduced-circulation state for several centuries • What might cause rapid breakdown?
Direct Greenhouse Warming Effect • If the density of the water in the North Atlantic Ocean were lowered by adding fresh water (rain) and/or by warming, rapid collapse of the THC can be envisioned • Increased rainfall and warming over the North Atlantic are both expected as a result of increased greenhouse gas concentrations • This allows an argument that global warming may cause a rapid collapse of the thermohaline circulation to be proposed
Weakening of THC in Climate Models • Intercomparison of changes in the North Atlantic THC simulated by a number of different General Circulation Models as a response to global warming was done by Gregory et al. 2005 • It showed that the THC weakens gradually in all of the climate models that were investigated, but it collapses in none of them
Climate Research Unit Conclusion • “The majority of climate scientist believe that a critical change in the THC is unlikely to occur during this century, but the question cannot be answered with certainty at present. Due to the potentially serious impact on our climate of a collapse of the THC, it must be regarded as a low-risk, high-impact event that cannot be ignored.”
Can THC Be Shut Off? • It has been suggested that very rapid climate change might result from drastic alteration of the THC, perhaps even shutting it down temporarily • The present day climate models cannot show this • Is there other evidence?
Willi Dansgaard • Danish paleoclimatologist, 1922 – 2011 • Formerly Professor Emeritus of Geophysics at the University of Copenhagen • Dansgaard demonstrated that measurements of the trace isotopes oxygen-18 and deuterium (heavy hydrogen) in accumulated glacier ice could be used as an indicator of climate and atmospheric environment
First Deep Ice Core • The first polar deep ice core drilling expedition took place in 1966, with the collection of the American Camp Century Core from Greenland • In cooperation with other laboratories, Dr. Dansgaard and his group performed the first isotopic analysis of the ice and perfected the methods to date the ice sheets and measure acidity and dust records, thus demonstrating its value as an environmental indicator
Hans Oeschger • Dr. Oeschger and his colleagues developed techniques for measuring radiocarbon on very small samples of carbon dioxide, oxygen isotopes, and the radiocarbon dating of ice • Swiss paleoclimatologist, 1927 - 1998 • Professor Emeritus, University of Bern
Carbon Dioxide Bubbles in Ice Cores • Their measurement of carbon dioxide concentrations from air bubbles trapped in ice revealed for the first time the important role that the world's oceans play in influencing global climate • Thus, it is now widely held that it is ocean-influenced changes in the levels of atmospheric gases that support the creation of the great glacial ice caps
Dansgaard-Oeschger Events • Oeschger began his work on isotopes and greenhouse gases around the same time as Dansgaard initiated his studies • Their combined work documented that abrupt climate swings are associated with changes in atmospheric greenhouse gases • The paradigm has come to be known as "Dansgaard-Oeschger events“, or D-O cycles
D-O Cycles • D-O events seem to occur with a period of 1470 years, plus or minus a few percent • The basic pattern is gradual cooling, followed by abrupt warming • D-O cycles are grouped into clusters, known as Bond cycles
Gerard Bond • American Geologist, 1940-2005 • Late Doherty Senior Scholar at Lamont Doherty Earth Observatory of Columbia University • Bond compared ice-core data with deep sea sediments • He counted the number and kinds of benthic foraminifera in cores • When forams die, they leave behind microscopic shells in the sediment
Foram Evidence • Some forams are associated with warm water, others with cold, and the shells of the different types are recognizable • Thus Bond discovered a crude paleothermometer, which could differentiate warm periods from cold periods • Bond discovered that after a large warming event, the next several D-O cycles would grow progressively colder
Termination of a Bond Cycle • In the middle of the coldest D-O event in a Bond Cycle it was observed that rock fragments of continental origin are found in abundance in deep-sea cores • Scientists drilling through marine sediments can distinguish six distinct events in cores of mud retrieved from the sea floor, which are labeled H1-H6 going back in time
Hartmut Heinrich • Marine geologist and climatologist, 1952 - present • Head of the Physics Department, Federal Maritime and Hydrographic Agency, Germany • He found six layers in ocean sediment cores with extremely high proportions of rocks of continental origin, "lithic fragments", in the 180 μm to 3 mm size range, which are too large to be transported by ocean currents • They are interpreted as having been carried by icebergs or sea ice which broke off from the large Laurentide ice sheet then covering North America, and dumped on the sea floor as the icebergs melted
Iceberg Transport • Armadas of icebergs broke off from glaciers and traversed the North Atlantic • The icebergs contained rock mass eroded by the glaciers, and as they melted, this matter was dropped onto the sea floor as “ice rafted debris” • The overall Bond cycle takes 8000-10,000 years, from one Heinrich event to the next • What caused the large number of icebergs? • The Heinrich events represent the period from 70,000 to 15,000 years before present
Heinrich Event Graph • Darker green bars represent the Heinrich events from Hemming 2004, while the lighter green represents alternative dates for events 2 through 4 from Bond • Dansgaard-Oeschger events can be seen most clearly in the Greenland delta 18O data
Cause of Heinrich Event • Each Heinrich event clearly represents a collapse of a large part of a Laurentide Ice Sheet • It is accompanied by a significant rise in sea-level, from 1-5 meters • The mechanism which caused the ice sheet collapse is still unexplained
Ice Sheet Collapse • Icebergs represent an efficient mechanism for ice sheet collapse, since they move from high latitudes with little insolation, to lower latitudes, with much stronger solar radiation • The Laurentide Ice Sheet, the source of the Heinrich glaciers, flowed into the ocean near 60° N latitude
Larsen B, Antarctic Peninsula • An example of the speed at which an ice shelf can collapse is shown in the animated photo file • The shelf had been stable for 12,000 years, but ice equivalent in size to Rhode Island broke apart in a five week period • Breakup was attributed to meltwater ponds forming on the surface during the summer months • Larsen B ice shelf breakup in February, 2002
Larsen B Size • Size comparison of Larsen B region with map of Rhode Island • Note color difference between cold freshwater melt, which is less dense than salt water, and the deep blue oceanwater
Abrupt Climate Change • The speed of the changes seen in the Bond cycles are much faster than the Milankovitch mechanisms can account for • During the 1990’s, there were many papers published about abrupt climate change, and many scientists are still working on the problem, often as their life’s work
Greenland Ice Sheet • The Greenland Ice Sheet is centered near 70° N • It is a warm ice sheet, near the melting point • Can the Greenland Ice Sheet behave like the Laurentide Ice Sheet, and generate a Heinrich event? • A key part of the answer deals with the way an ice sheet flows
Ice Flow by Deformation • Ice sheets which are solidly frozen to their base can flow only by internal deformation of ice within the sheet • Ice at the bottom is fixed, while ice higher in the sheet breaks and moves • Such flow is slow
The Importance of the Moulin • If the ice near the base is warmer, it begins to melt • Meltwater from the surface may work its way to the bottom • Together bottom melting and water from above can lubricate the glacier, allowing it to move as a mass, and much faster than movement by deformation • This is why moulins are so important!
Heat transfer in Glaciers • The models currently in use for ice sheet heat transfer involve thermal conduction from the top to the bottom of the ice sheet • This would require thousands of years for heating at the surface to affect the base of the glacier • Observations indicate the real lag time is measured in months
Moulin Heat Transport • Moulins are obviously the source of the rapid heat transfer • The problem is that the ice column is below the freezing point • How does water from the surface make it to the base of the glacier without refreezing? • No mechanism is known, so the modelers cannot incorporate this mechanism in their models
Cycles and Models • Although the General Circulation Models cannot properly imitate Pleistocene climatic behavior, more specialized models do show a relationship between D-O cycles, the iceberg armadas of Heinrich events, and the conveyor belt currents • In particular, they suggest the conveyor belt may turn on and off, a feature the more general models do not show