
Uploaded by
mignon
11 SLIDES
163 VUES
110LIKES
Graphing Booklet: 3rd Grade 2007-2008
DESCRIPTION
Explore various types of graphs for data representation with examples, from bar graphs to line graphs to pictographs and pie charts in this informative booklet designed for 3rd graders in the academic year 2007-2008.
Download
1 / 11
Télécharger la présentation 
Graphing Booklet: 3rd Grade 2007-2008
An Image/Link below is provided (as is) to download presentation
Download Policy: Content on the Website is provided to you AS IS for your information and personal use and may not be sold / licensed / shared on other websites without getting consent from its author.
Content is provided to you AS IS for your information and personal use only.
Download presentation by click this link.
While downloading, if for some reason you are not able to download a presentation, the publisher may have deleted the file from their server.
During download, if you can't get a presentation, the file might be deleted by the publisher.
E N D
Presentation Transcript
Graphing Booklet 3rd Grade 2007-2008
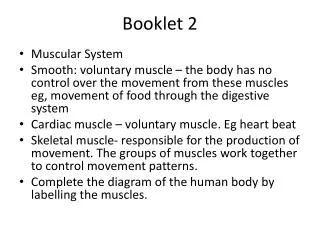
Bar Graphs • A graph that uses horizontal or vertical bars to represent various kinds of information.
Line Graph • A graph formed by segments of straight lines that join the points representing certain data. Line graphs show changes over time.
Pictograph (Pictogram) • A graph drawn with pictures that represent the real objects.
Circle graph or Pie Chart • A circle graph is a pie chart. It is a graph that is created in a circle and shows the number, percent, or how something is divided.


More Related