Download

1 / 63
650 likes | 691 Vues
Understand genome-wide association tests in unrelated individuals, population stratification assessment, replication, dominant model, and logistic regression. Learn about Covariates, SNP, Collider Bias, and Population Stratification in lung cancer.

E N D
Genome-wide Association David Evans University of Queensland
Queensland View from Evans’ Laboratory* *Presenter makes no guarantees wrt veracity of statements made in the course of this presentation
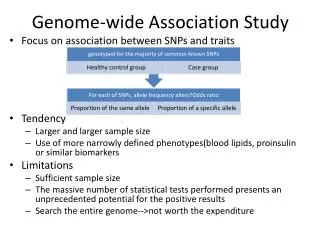
This Session • Tests of association in unrelated individuals • Population Stratification • Assessing significance in genome-wide association • Replication • Population Stratification Practical
Simple Additive Regression Model of Association (Unrelated individuals) Yi = a + bXi + ei where Yi = trait value for individual i Xi = number of ‘A’ alleles an individual has 1.2 1 0.8 Y 0.6 0.4 0.2 0 X 0 1 2 Association test is whether b > 0
Linear Regression Including Dominance Yi = a + bxXi + bzZi + ei where Yi = trait value for individual i Xi = 1 if individual i has genotype ‘AA’ Zi= 0 for ‘AA’ 0 if individual i has genotype ‘Aa’ 1 for ‘Aa’ -1 if individual i has genotype ‘aa‘ 0 for ‘aa’ 1.2 1 a d 0.8 -a Y 0.6 0.4 0.2 0 0 1 X 2
Genetic Case Control Study Controls Cases G/G G/T T/T T/T T/G T/G T/T T/T T/G G/G T/G T/G T/G T/T Allele G is ‘associated’ with disease
Each individual contributes two counts to 2x2 table. Test of association where X2 has χ2 distribution with 1 degrees of freedom under null hypothesis. Allele-based tests
SNP marker data can be represented in 2x3 table. Test of association where X2 has χ2 distribution with 2 degrees of freedom under null hypothesis. Genotypic tests
Each individual contributes two counts to 2x2 table. Test of association where X2 has χ2 distribution with 1 degrees of freedom under null hypothesis. Dominance Model
Logistic regression framework • Model case/control status within a logistic regression framework. • Let πi denote the probability that individual i is a case, given their genotype Gi. • Logit link function where
Indicator variables • Represent genotypes of each individual by indicator variables:
Likelihood calculations • Log-likelihood of case-control data given marker genotypes where yi = 1 if individual i is a case, and yi = 0 if individual i is a control. • Maximise log-likelihood over β parameters, denoted . • Models fitted using PLINK.
Model comparison • Compare models via deviance, having a χ2 distribution with degrees of freedom given by the difference in the number of model parameters.
Covariates • It is straightforward to incorporate covariates in the logistic regression model: • age, gender, and other environmental risk factors. • Generalisation of link function, e.g. for additive model: where Xij is the response of individual i to the jth covariate, and γj is the corresponding covariate regression coefficient.
Caution with Covariates! • Covariates useful for: • Controlling for confounding • Increasing power • Should be used with caution! Lung Cancer SNP Smoking
Caution with Covariates! SNP SNP “Collider” Bias BMI CHD G, E (-SNP) SNP “Collider” Bias Outcome Covariate
Caution with Covariates! • Intuition is different for binary traits! • Case control studies only • Can increase or decrease power • Depends on prevalence of disease (<20%) • Most apparent for strongly associated covariates
Definitions: Stratification and Admixture • Stratification / Sub-structure Refers to the situation where a sample of individuals consists of several discrete subgroups which do not interbreed as a single randomly mating unit • Admixture Implies that subgroups also interbreed. Therefore individuals may be a mixture of different ancestries.
Population structure Marchini, Nat Genet (2004)
ADMIXTURE: (DIABETES IN AMERICAN INDIANS) Full heritage American Indian Population +- Gm3;5,13,14~1% ~99% (NIDDM Prevalence 40%) Caucasian Population + - Gm3;5,13,14~66% ~34% (NIDDM Prevalence 15%) Study without knowledge of genetic background: OR=0.27 95%CI = 0.18 - 0.40
Index of Indian Heritage Gm3;5,13,14 + - 0 17.8% 19.9% 4 28.3% 28.8% 8 35.9% 39.3% ADMIXTURE: (DIABETES IN AMERICAN INDIANS) Gm haplotype serves as a marker for Caucasian admixture
QQ plots McCarthy et al. (2008) Nature Genetics
Solutions (common variants) • Family-based Analysis • Stratified Analysis • Analyze Chinese and American samples separately then combine statistically • Model the confounder • Include a term for Chinese or American ancestry in a logistic regression model • Principal Components • Genomic Control • Linear Mixed Models • LD score regression
Transmission Disequilibrium Test • Rationale: Related individuals have to be from the same population • Compare number of times heterozygous parents transmit “A” vs “C” allele to affected offspring • Many variations AC AA AC
TDT Spielman et al 1993 AJHG
TDT Advantages • Robust to stratification • Identification of Mendelian Inconsistencies • Parent of Origin Effects • More accurate haplotyping AC AA AC
TDT Disadvantages • Difficult to gather families • Difficult to get parents for late onset / psychiatric conditions • Genotyping error produces bias • Inefficient for genotyping (particularly GWA) AC AA AC
Case-control versus TDT α = 0.05; RAA = RAa = 2
2 Stratification adjust test statistic Genomic control 2 No stratification Test locus Unlinked ‘null’ markers
Genomic control “λ” is Genome-wide inflation factor Test statistic is distributed under the null: TN / ~ 21 Problems…
Principal Components Analysis • Principal Components Analysis is applied to genotype data to infer continuous axes of genetic variation • Each axis explains as much of the genetic variance in the data as possible with the constraint that each component is orthogonal to the preceding components • The top principal Components tend to describe population ancestry • Include principal components in regression analysis => correct for the effects of stratification • EIGENSTRAT, SHELLFISH
Novembre et al, Nature (2008) Principal Component Two Principal Component One
Population structure - Disease Genomic control- genome-wide inflation of median test statistic
Disease collection center Center 3: = 1.77 All others: = 1.09
Linear Mixed Models • The test of association is performed in the fixed effects part of the model (“model for the means”) • “Relatedness” between individuals (due to both population structure and cryptic relatedness) is captured in the modelling of the covariance between individuals • Can increase power by implicitly conditioning on associated loci other than the candidate locus (quantitative traits) • Variety of software packages (e.g. GCTA, GEMMA, LMM-BOLT)
Linear Mixed Models y = Xβ+ g + ε y is N x 1 vector of observed phenotypes X is N x k vector of observed covariates β is k x 1 vector of fixed effects coefficients g is N x 1 vector of total genetic effects per individualg ~(0, Aσg2) A is the GRM between different individuals V = Aσg2 + Iσε2
Example Sawcer et al, Nature (2011)
Comparison of Approaches in Sawcer et al. No correction PCA correction (top 100 PCs) Mixed-model correction
Linear Mixed Models - Complexities • Many markers required for proper control of stratification • Inclusion of the causal variant in the GRM will decrease power to detect association (GCTA-LOCO) • Case-control analyses are a different story and these sorts of models can involve a substantial decrease in power
LD Score Regression- Key Points • A key issue in GWAS is how to distinguish inflation by polygenicity from bias • This is increasingly important as the size of GWAS (meta-analyses) increases • LD score regression quantifies the contribution of each by examining the relationship between the test statistics and LD • Estimates a more accurate measure of test score inflation than genomic control
LD Score Regression- Basic Idea • The basic idea is that the more genetic variation a marker tags, the higher the probability that it will tag a causal variant • In contrast, variation from population stratification/cryptic relatedness shouldn’t correlate with LD • Regress test statistics from GWAS against LD score. The intercept minus one from this regression is an estimator of the mean contribution of confounding to the inflation of the test statistics