Download
1 / 50
510 likes | 713 Vues
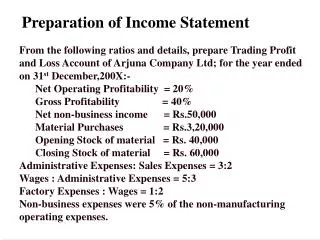
Preparation of Income Statement. From the following ratios and details, prepare Trading Profit and Loss Account of Arjuna Company Ltd; for the year ended on 31 st December,200X:- Net Operating Profitability = 20% Gross Profitability = 40%

E N D
Preparation of Income Statement • From the following ratios and details, prepare Trading Profit and Loss Account of Arjuna Company Ltd; for the year ended on 31st December,200X:- • Net Operating Profitability = 20% • Gross Profitability = 40% • Net non-business income = Rs.50,000 • Material Purchases = Rs.3,20,000 • Opening Stock of material = Rs. 40,000 • Closing Stock of material = Rs. 60,000 • Administrative Expenses: Sales Expenses = 3:2 • Wages : Administrative Expenses = 5:3 • Factory Expenses : Wages = 1:2 • Non-business expenses were 5% of the non-manufacturing operating expenses.
Solution to the Problem Unit in Rs. Computation of Cost of Sales : - Opening stock = 40,000 + Purchases = 3,20,000 - Closing stock = (60,000) Cost of Sales = 3,00,000 Gross Profit = 40% of Sales –(1) Net operating Profit = 20% of Sales –(2) (Gross Profit - Net operating Exp) Therefore Net Operating Exp = 20% of Sales (Admin.+ Selling Exp.=Ope. Exp.) Therefore (Admn.+ Selling)Exp. = 20% of Sales (Admn.: Selling Exp = 3:2) Therefore Admn. Exp.= 12% of Sales -(3) Therefore Selling Exp.= 8% of Sales –(4) Therefore Wages = (5/3) x 12% (Wages: Admin = 5:3) = 20% of Sales – (5) Therefore Factory Expenses = (1/2) x 20% = 10% of Sales –(6) (Factory Exp:Wages = 1: 2)
Trading Profit and Loss A/c. for the Period 31st December,200X: Sales = Gross Profit + Cost of Sales + Wages + Factory expenses S = 0.40 x S + 3,00,000 + 0.2 x S + 0.1 x S Therefore 0.3 Sales = 3,00,000 Therefore Sales = 10,00,000 Wages = 2,00,000 Factory Exp. = 1,00,000 Gross Profit = 4,00,000 Admn. Exp. = 1,20,000 Non Manufacturing Selling Exp. = 80,000 Operating Exp.=2,00,000. Net operating Profit = 2,00,000 - (1) Net Non Business Inc.= 50,000 – (2) Non Business Exp. = 0.05 x 2,00,000 = 10,000 – (3) (5% of Non Manufacturing Operating Expenses) Therefore Net Profit = 2,40,000 ( 1 + 2 – 3 ) Unit in Rs.
Product Price Budgeting Decisions Following is the B/S of Bombay Co.Ltd. As on 31st March 200X : Investment (Assets) Rs.Lacs Fixed Assets 200 Add : W. C. 100 300 Sources used (Liabilities) Equity Share Capital 50 Reserves 150 14 % Debentures 100 300
The Co. produces 3 products A, B & C. • Following are some important estimations for 200X – 200X1 : • Co. will sell 2,000, 4,000 & 8,000 units of A, B & C respectively. • P/V ratio of A, B, & C will be 50 % , 40 % & 60 % respectively. • Co. will have to maintain the ratio of “Sale Price Per Unit” of A,B & C as 5:3:2. • Co. expects 10 % increase in reserves. It would like to give 10 % dividend on share capital. • Co’s. tax rate is 50 %. Fixed Assets are depreciated at 10 % p.a. • Other Operating Fixed Costs will remain at Rs. 1 Lac. • Required : 1 Fixation of per unit sale price of A, B & C. • 2. Estimated Income Statement of 200X – 200X1 . • 3. Estimated Balance Sheet as on 31st March 200X1.
Solution:-Income Statement • Workings are required to start from the bottom line in this case. • 10% increase in Reserves means Retained Earnings are 10% of last years’ reserves. i.e. Rs.15 Lacs. • Dividend is declared at 10% on Share Capital i.e. Rs.5Lacs. Therefore, PAT = Retained Earnings + Dividend = Rs. 20 Lacs. • Co’s Tax rate is 50%. therefore,Tax = Rs.20 Lacs and PBT = Rs. 40 Lacs. • Interest paid on 14% Debentures of Rs.100 Lacs is Rs.14 Lacs Therefore PBIT = Rs.54 Lacs. • Fixed Assets are depreciated at 10% p.a. i.e. Depreciation is Rs. 20 Lacs when added to other Operating Fixed Costs of Rs.1 Lac results into Total Operating Fixed Costs of Rs.21 Lacs. • Therefore, Contribution = PBIT + Operating Fixed Costs = Rs. 75 Lacs.
Computation of Sales Price Therefore, Total Sales = Rs. 1,46,90,780 = Rs. 146.91 Lacs Therefore, Variable Cost = Rs. (146.91 –75) = Rs.71.91 Lacs
Preparation of Balance Sheet Rs. Lacs • New Reserves : 150 (old) + 15 (addition) = 165 • New Fixed Assets : 200 (old) – 20 (Depreciation) = 180 • New Working Capital : Own Funds + Borrowing – Fixed Assets = (215 + 100 – 180) = Rs. 135 Lacs. • Therefore, Change in W.C.= Rs.135 Lacs – Rs.100 Lacs = Rs.35 Lacs. • This Increase is on A/c of : Depreciation = Rs.20 Lacs Add : Retained Earnings = Rs.15 Lacs = Rs.35 Lacs
Budgeting for Divisional Performance Following are the Performance Details of the Divisions of Modern Co. Ltd., of the year ended on 30-09-200X :- • Additional information about the year ended on 30-09-200X • Activity Level Achieved was same for Sales and Production. (i.e. No opening or Closing Stocks). • Break-up of Variable Cost for these Divisions was -
(3) Head Office Fixed Cost = Rs. 40,000. • Estimations for the year to end on 30-09-200X1. • All Divisions will achieve 90% Activity Level of Sales and Production. (i.e. No opening or Closing Stocks). • Head Office Fixed Cost will Increase by 10%. • Selling Price of Division ‘A’ and ‘B’ will be Increased by 5%. • Material Prices will Increase by 5% for all the Divisions. • You are required to Prepare ‘Estimated Performance Statement’ for 200X – X1 , with Maximum Details.
Sales = 800000 * 90/80 * 105/100 = 945000 Material = 200000 * 90/80 * 105/100 = 236250 Sundry = 40000 * 90/80 = 45000 Pkg. & processing = 160000 *90/80 = 180000 For Division A
Sales = 600000 * 90/60 * 105/100 = 945000 Material = 120000 * 90/60 * 105/100 = 189000 Pkg. & processing = 90000 * 90/60 = 135000 Sundry = 90000 * 90/60 = 135000 For Division B
Sales = 900000 * 90/50 = 1620000 Material = 360000 * 90/50 * 105/100 = 680400 Pkg. & processing = 180000 * 90/50 = 324000 Sundry = 60000 * 90/50 = 108000 For Division C
PROBLEMS ON BUDGETING PRODUCT MIX DECISIONS Wizard Ltd. Manufactures 3 Products A,B& C. The relevant data for which are as follows : A B C Rs Rs Rs Sales Price Per Unit 30 28 32 Cost Data Per Unit 24 23 25 Raw Material 11 12 9 Direct Labour 4 6 7 Variable Overheads 9 5 9 Machine Hrs. required /Unit 2 3 4
The other constraints are : • Total Machine Hour Capacity available is 50,000. • Fixed Overheads are Rs. 50,000/- • Following are the Minimum and Maximum Quantities of each of the Products that need to be Manufactured and Sold : • Minimum Quantity 1,000 2,000 3,000 • Maximum Quantity 20,000 15,000 11,000 • Compute the Maximum Profit that can be achieved under the circumstances
BUDGETING FOR PRODUCT MIX DECISIONS Solution : Computation of Contribution per machine hour : Therefore Ranking for manufacturing basis contribution: A,C and B Machine hrs. Required for [1,000 x 2=2,000][2,000x3=6,000][3,000x4=12,000] Minimum quantity Total 20,000 machine hours.
Thus remaining machine hours (30,000) are available for maximistion of contribution. If all the 30,000 machine hours are used for producing the product A (having highest contribution) then no. of units of A produced= 30,000 / 2 =15,000. Thus total no. of units of A produced and sold= 15,000+1,000 (minimum no.) = 16,000 < 20,000 less than the maximum quantity of ‘A’ is allowed. (a) Therefore ideal product mix and maximum contribution:- (b) Maximum Profit = Contribution – Fixed Overheads = (1,27,000 – 50,000) =77,000 Rs.
(D) 0.5 = 1,10,000 – 90,000 • S – 2,00,000 • 0.5S = 20,000 + 1,00,000 • therefore S = 1,20,000 / 0.5 = 2,40,000 Rs. • (E) Increase in fixed costs = 50% i.e. = 15,000 Rs. • therefore 15,000 = 20,000 x PV ratio • therefore PV ratio = 0.75
BUDGETING FOR RAW MATERIAL Modern India Co. Ltd. Produces and Sells three Products – X,Y and Z. All these Products Consume common Raw Material. As a strategy, the company Produces and Sells at least 50,100 and 50 units of X,Y and Z every year, irrespective of their Profitability. Following are further Details Available :-
Following are some estimations for the year 200X – X1 :- • Maximum available Material will be 10,000 Kgms. • Price per Kg. of Material will be Rs.2. • Wage Rate per Labour Hour will be Re.1. • Variable Overheads will be 100% of Wages. • Fixed Cost for 200X – X1 will be Rs.5,000. • Maximum Demand for X and Y will be 300 and 400 Units respectively. • You are required to decide the Optional Product Mix for 200X – X1, to maximise the overall Profit of the Company and also prepare the “Performance Statement” for 200X – X1 with maximum possible details.
Solution Unit in Kgs. Material cost = Rs. 2 per unit Labour cost = Re. 1 per hour
Maximum units of X that can be produced = 300 units Material used = 300 * 4 = 1200 kg. Maximum units of Y that can be produced = 400 units Material used = 400 * 5 = 2000 kg. Material left = 10000 – (2000 + 1200) = 6800 kg. Maximum units of Z that can be produced = 6800/10 = 680 units
SALES VARIANCE ANALYSIS– The Value Method The Budgeted & actual sales of DCP Ltd. For the year 200X are as follows : Required : Detailed analysis of Sales Variances
Problem on Sales Variance Analysis (Value Method) Sales Price Variance = Actual Quantity ( Budgeted Sales Price –Actual Sales Price) Quantities in Kgs., and Prices and Variances are in Rs.
Sales Volume Variance = Budgeted Sales Price (Budgeted Quantity–Actual Quantity) Quantities in Kgs., and Prices and Variances are in Rs.
Sales Value Variance = Budgeted Sales Price x Budgeted Quantity–Actual Sales Price x Actual Quantity Quantities in Kgs., and Prices and Variances are in Rs.
SALES VARIANCE ANALYSIS – The Profit Method The Budget & actual Sales of Households Products Ltd. As of March 200X are as follows : The Marginal Cost of Sales Per Unit of A,B &C was Rs. 45, Rs. 85 & Rs. 65 respectively. Required: Different Variances to explain the difference between the Budgeted and Actual Profit.
Problem on Sales Variance Analysis (Profit Method) Quantities in Kgs., and Prices and Variances are in Rs.
Sales Price Variance = Actual Quantity ( Budgeted Margin – Actual Margin ) Quantities in Kgs., and Prices and Variances are in Rs.
Sales Volume Variance = Budgeted Margin ( Budgeted Quantity- Actual Quantity ) Quantities in Kgs., and Prices and Variances are in Rs. Sales Value Variance= Sales Price Variance + Sales Qty. Variance = - 4800 + - 250 Total: Rs. 5050 Favourable Variance
A Case Study on Responsibility Accounting for Performance Evaluation using Variance Analysis Technique Phase 1 Preparing a Budget Statement The Chempro India Pvt. Ltd. prepared its annual sales budget for the year 2000 as shows below: Rs. Total Sales 5,00,000 Budget performance (sales) from each territorial manager: Manager --- Territory A 1,20,000 Manager --- Territory B 1,30,000 Manager --- Territory C 1,60,000 Manager --- Territory D 90,000 5,00,000 The Sales General Manager is responsible for the Overall Sales Performance of the company and the territorial managers are accountable to him.
Phase 2 Recording the Actual Performance during the Year Rs. Total Sales 6,00,000 Actual Sales Performance from each Territorial Manager: Manager --- Territory A 1,40,000 Manager --- Territory B 1,20,000 Manager --- Territory C 2,70,000 Manager --- Territory D 70,000 6,00,000
Phase 3: Calculating the Favourable and Unfavourable Variances Note : F= Favourable ; A = Adverse The Sales General Manager submitted his Divisional Performance Report with the above variances to the Managing Director of the Company. The Territorial Sales Managers gave the causes for the Various Variances as follows: A: Extra Efforts B: Delayed Supplies from Factory C: Extra Efforts and New Marketing Strategies D: Delayed Supplies from Factory
Phase 4: Finding out the true causes of the Variances. Generally, there is a tendency that the people responsible for bad performance blame it on someone else. Therefore there is no specific way to find out the cause of a good/poor variance. As long as the variance is good the person is rewarded , due to which he may try and grab the reward for the TOTAL good performance which may not be only due to him. Therefore the true cause of variance need to be Known so as to give a suitable reward/penalty. One person alone should not gain/lose everything if he could alone not control the good/bad variance. Such causes also decided the extent to which the standards should be revised, i.e. the same standards of performance cannot be expected under different operational / economical circumstances. The cause given for the good/bad performance may be true or false as the general manager (sales) may not clearly state the reasons for his subordinates’ performance as ultimately he is responsible for it. Hence the managing director should assign such work to the managing accountant who shall in return find out the true causes.
E.g. The true causes of the variance in the Chempro India Pvt. Ltd. Werefound as follows by the Managing Accountant:
Note:It is difficult and to an extent subjective to decide the degree of controllability for a particular cause, i.e. whether the variance is C or UC e.g. a responsible person argues the cause of an adverse variance is UC and his superior may say it to be C e.g. in item 9. Since the favourable variance is a result of the govt. Order the response of manager C is also important as he might have grabbed the govt. order with his awareness.
Phase 6 Deciding the quantum of Reward / Penalty The person should be penalized/rewarded for only the controllable portion of his Favourable/Unfavourable variance. In the illustration the sales manager of territory D will not be penalized because his advise variance was due to UC factors. Similarly manager C will be rewarded only 70,000 as out of his whole favourable variance, only that much was controllable. Manager B has a variance of 11,000 (A) and a 1000 (F). He will be proportionately penalized and rewarded. Manager A will be rewarded only 50% of his favourable variance as only that much is in his control.
Phase 7 Revising the standards of performance Due to fast changing operational/ financial environments / methods/ techniques/ expectations requirements, standards of performance have to be timely revised. The causes for the variances have to be studied carefully and the degree of controllability has to be analysed with trend technique. The following illustration will explain this aspect further. Annual Sales Budget from Jan’95-Dec’2002 Rs. 1,60,000 Avg. Actual Annual Sales achieved in above period Rs. 1,70,000 Yearly sales variance (F) Rs. 10,000 Frequent cause for yearly Variance Govt. order not estimated each year
Therefore the Additional Sales of Rs. 10,000 should be added regularly for 6 years to the budget of 2001 and it should increase to 1,70,000. This revision made is a result of the frequent additional sales and is expected to flow in the coming years as well. • If there is a favourable trend in a particular territory in the Variance, the Sales Budget of the coming year may be more Optimistic and this may also be introduced to the Other Budgets along with the techniques to show the results of the same. • Penalty / Reward for Individual Sales Performances and revisions in the Budgets for the coming year • The Variances Analysis Techniques is used to : • To Decide the Penalty / Reward Quantum • The revision to be made to frame the Individual Sales Budget for the coming year.
The following table shall explain this: C = Controllable R= Recurring NR = Non Recurring UC = Uncontrollable
Therefore with the above technique we can make an approximate budget of the Chempro India Pvt. Ltd. for the year 2001 and figure out the treatment that shall be rendered to the 4 Territorial Managers for their performance in the financial year. Continued …
Continued … OB = Original Budget; Only Recurring Variances are considered for revision in the budget of 2001. Therefore the budget of 2001 will Increase or Decrease due to the estimation for 2001 about other Variables/ Constraints.
The Territorial Sales Managers shall be given the following Rewards / Penalties for their respective Variances of 2000 General Sales ManagerSome of the UC, i.e. F and A variances of the Territory Manger can be controlled by the General Sales Manager. Hence all the above Variances will have to be reanalysed with the aspect of controllability to determine the Penalty/ Reward for the General Sales Manager.