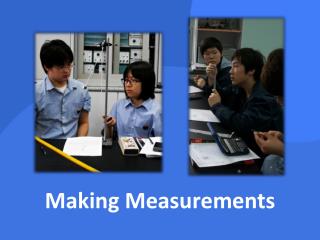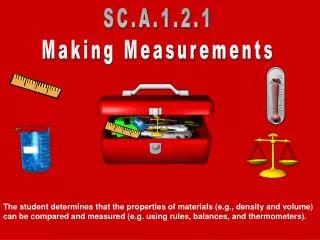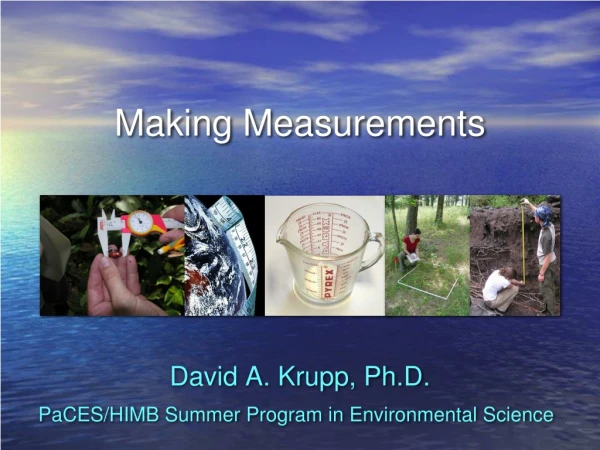
Making measurements
130 likes | 330 Vues
Making measurements. Length- a measure of the straight-line distance between two points Mass- a measure of the amount of matter in an object Volume- a measure of the size of a body or region in three-dimensional space Weight-a measure of the gravitational force exerted on an object.

Making measurements
E N D
Presentation Transcript
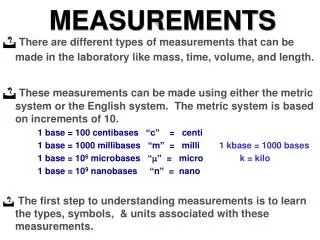
Length- a measure of the straight-line distance between two points • Mass- a measure of the amount of matter in an object • Volume- a measure of the size of a body or region in three-dimensional space • Weight-a measure of the gravitational force exerted on an object
Ex) when astronauts travel to the moon, they have the same mass. However, they weigh less because the moon is smaller (in size and mass) than Earth. The change in weight is due to a change in gravitational attraction between the astronaut and Earth and the astronaut and the moon.
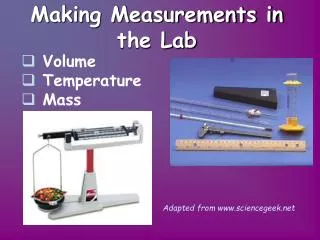
Organizing Data Objectives: • interpret line graphs, bar graphs, and pie charts • Use scientific notation and significant figures in problem solving • Identify the significant figures in calculations • Understand the difference between precision and accuracy
Line graph- best for displaying data that change. Generally displays two variables (example time and volume). • Time is the independent variable because it was chosen to take the measurements. • The volume of gas is the dependent variable because its value depends on what happens in the experiment
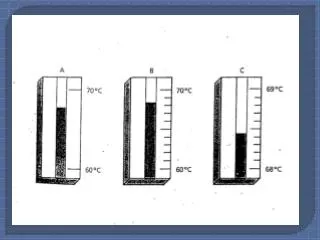
Line graphs • Line graphs usually display the x-axis showing the independent variable and the y-axis showing the dependent variable. • Notice that in-between volumes can be estimated
Bar Graphs • Bar graphs- useful when you want to compare similar data for several individual items or events
Pie chart- ideal for displaying data that are parts of a whole
Scientific Notation • 104 =10 000 scientific notation- a • 103= 1000 method of expressing a • 102= 100 quantity as a number multiplied by 10 to the • 101= 10 appropriate power • 100= 1 • 10-1 = 0.1 • 10-2= 0.01 • 10-3= 0.001
Practice problems • 1. Write the following measurements in scientific notation: 800 000 000 m 0.0015 kg 60 200 L 0.000 95 m 8 002 000 km 0.000 000 000 06 kg
Practice Problems • Write the following measurements in long form: 4.5 x 10³ g 6.05 x 10⁻³ m 3.115 x 10⁶ km 1.99 x 10⁻⁸ cm