DC and AC Circuit analysis
DC and AC Circuit analysis. Circuit analysis is the process of finding the voltages across, and the currents through, every component in the circuit.


DC and AC Circuit analysis
E N D
Presentation Transcript
DC and AC Circuit analysis • Circuit analysis is the process of finding the voltages across, and the currents through, every component in the circuit. • For dc circuits the components are resistive as the capacitor and inductor show their total characteristics only with varying voltage or current. • Sinusoidal waveform is one form of alternating waveform where the amplitude alternates periodically between two peaks. Kent Bertilsson Muhammad Amir Yousaf
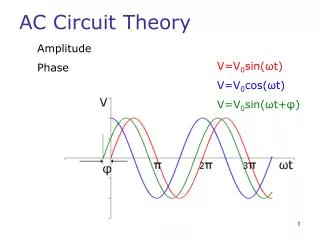
Sinusoidal Waveform • Unit of measurement for horizontal axis can be time , degrees or radians. Kent Bertilsson Muhammad Amir Yousaf
Sinusoidal Waveform • Unit of measurement for horizontal axis can be time , degrees or radians. • Vertical projection of radius vector rotating in auniform circular motion about a fixed point. • Angular Velocity • Time required to complete one revolution is T Kent Bertilsson Muhammad Amir Yousaf
Sinusoidal Waveform • Mathematically it is represented as: Kent Bertilsson Muhammad Amir Yousaf
Frequency of Sinusoidal • Every signal can be described both in the time domain and the frequency domain. • Frequency representation of sinusoidal signal is: Muhammad Amir Yousaf
A periodic signal in frequency domain • Every signal can be described both in the time domain and the frequency domain. • A periodic signal is always a sine or cosine or the sum of sines and cosines. • Frequency representation of periodic signal is: V fs 2 fs 3 fs 4 fs 5 fsf Kent Bertilsson Muhammad Amir Yousaf
A periodic signal in frequency domain • A periodic signal (in the time domain) can in the frequency domain be represented by: • A peak at the fundamental frequency for the signal, fs=1/T • And multiples of the fundamental f1,f2,f3,…=1xfs ,2xfs ,2xfs V T=1/fst V fs 2 fs 3 fs 4 fs 5 fsf Kent Bertilsson Muhammad Amir Yousaf
Non periodic signal in frequency domain • A non periodic (varying) signal time domain is spread in the frequency domain. • A completely random signal (white noise) have a uniform frequency spectra V Noise f Kent Bertilsson Muhammad Amir Yousaf
Why Frequency Representation? • All frequencies are not treated in same way by nature and man-made systems. • In a rainbow, different parts of light spectrum are bent differently as they pass through a drop of water or a prism. • An electronic component or system also gives frequency dependent response. Kent Bertilsson Muhammad Amir Yousaf
Phase Relation • The maxima and the minima at pi/2,3pi/2 and 0,2pi can be shifted to some other angle. The expression in this case would be: Kent Bertilsson Muhammad Amir Yousaf
Derivative of sinusoidal Kent Bertilsson Muhammad Amir Yousaf
Response of R to Sinusoidal Voltage or Current • Resistor at a particular frequency Kent Bertilsson Muhammad Amir Yousaf
Response of L to Sinusoidal Voltage or Current • Inductor at a particular frequency Kent Bertilsson Muhammad Amir Yousaf
Response of C to Sinusoidal Voltage or Current • Capacitor at a particular frequency Kent Bertilsson Muhammad Amir Yousaf
Frequency Response of R,L,C • How varying frequency affects the opposition offered by R,L and C Kent Bertilsson Muhammad Amir Yousaf
Complex Numbers • Real and Imaginary axis on complex plane • Polar Form • Rectangular Form Kent Bertilsson Muhammad Amir Yousaf
Conversion between Forms • Real and Imaginary axis on complex plane Kent Bertilsson Muhammad Amir Yousaf
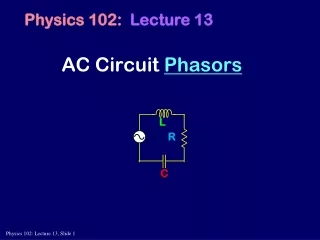
Phasors • The radiusvector, having a constant magnitude (length) with one end fixed at the origin, is called a phasor when applied to electric circuits. Kent Bertilsson Muhammad Amir Yousaf
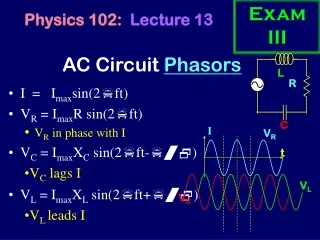
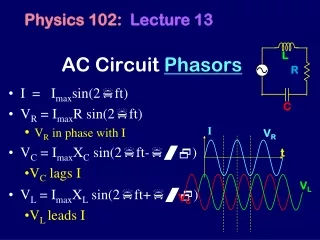
R,L,C and Phasors • How to determine phase changes in voltage and current in reactive circuits Kent Bertilsson Muhammad Amir Yousaf
R,L,C and Phasors • How to determine phase changes in voltage and current in reactive circuits Kent Bertilsson Muhammad Amir Yousaf
Impedance Diagram • The resistance will always appear on the positive real axis, the inductive reactance on the positive imaginary axis, and the capacitive reactance on the negative imaginary axis. • Circuits combining different types of elements will have total impedances that extend from 90° to -90° Kent Bertilsson Muhammad Amir Yousaf
R,L,C in series Kent Bertilsson Muhammad Amir Yousaf
Voltage Divide Rule Kent Bertilsson Muhammad Amir Yousaf
Frequency response of R-C circuit Kent Bertilsson Muhammad Amir Yousaf
Bode Diagram • It is a technique for sketching the frequency response of systems (i.e. filter, amplifiers etc) on dB scale . It provides an excellent way to compare decibel levels at different frequencies. • Absolute decibel value and phase of the transfer function is plotted against a logarithmic frequency axis. Kent Bertilsson Muhammad Amir Yousaf
Decibel, dB • decibel, dB is very useful measure to compare two levels of power. • It is used for expressing amplification (and attenuation) Kent Bertilsson Muhammad Amir Yousaf
Bode Plot for High-Pass RC Filter Kent Bertilsson Muhammad Amir Yousaf
Sketching Bode Plotfor High-Pass RC Filter • High-Pass R-C Filter Voltagegain of the system is: In magnitude and phase form For f << fc For fc << f Kent Bertilsson Muhammad Amir Yousaf
Bode PlotAmplitude Response • Must rememberrules for sketching Bode Plots: Twofrequenciesseparated by a 2:1 ratio are said to be an octave apart. For Bode plots, a change in frequency by oneoctavewillresult in a 6dB change in gain. Twofrequenciesseparated by a 10:1 ratio are said to be a decade apart. For Bode plots, a change in frequency by onedecadewillresult in a 20dB change in gain. Trueonly for f << fc Kent Bertilsson Muhammad Amir Yousaf
Asymptotic Bode Plotamplitude response • Plottingeqbelow for higherfrequencies: • For f= fc/10 AvdB= -20dB • For f= fc/4 AvdB= -12dB • For f= fc/2 AvdB= -6dB • For f= fcAvdB= 0dB • This gives an idealizedbodeplot. • Through the use of straight-line segments called idealized Bode plots, the frequency response of a system can be found efficiently and accurately. Kent Bertilsson Muhammad Amir Yousaf
Actual Bode PlotAmplitude Response • For actual plot using equation • For f >> fc , fc/ f = 0 AvdB= 0dB • For f = fc , fc / f = 01AvdB = -3dB • For f = 2fc AvdB= -1dB • For f = 1/2fcAvdB = -7dB • At f = fc the actualresponsecurve is 3dBdown from the idealized Bode plot, whereas at f=2fc and f = fc/2 the acutualresponse is 1dBdown from the asymptoticresponse. Kent Bertilsson Muhammad Amir Yousaf
Asymptotic Bode PlotPhase Response • Phase response can also be sketched using straight line asymptote by considering few critical points in frequency spectrum. • Plottingaboveequation • For f << fc , phaseaproaches 90 • For f >> fc, phaseaproches 0 • At f = fc tan^-1 (1) = 45 Kent Bertilsson Muhammad Amir Yousaf
Asymptotic Bode PlotPhase Response • Must rememberrules for sketching Bode Plots: An asymptote at theta = 90 for f << fc/10, an asymptote at theta = 0 for f >> 10fc and an asymptote from fc/10 to 10fc that passesthroughtheta = 45 at f= fc. Kent Bertilsson Muhammad Amir Yousaf
Actual Bode PlotPhase Response • At f = fc/10 • 90 – 84.29 = 5.7 • At f = 10fc • At f= fctheta = 45 whereas at f=fc/10 and f=10fc, the difference the actual and asymptoticphaseresponse is 5.7 degrees Kent Bertilsson Muhammad Amir Yousaf
Bode Plot for RC low pass filter • Draw an asymptotic bode diagram for the RC filter. Kent Bertilsson Muhammad Amir Yousaf
Bode Plot for RC low pass filter • Draw an asymptotic bode diagram for the RC filter. In terms of poles and Zeros: Pole at wc Kent Bertilsson Muhammad Amir Yousaf
Bode diagram for multiple stage filter • According to logarithmic laws Kent Bertilsson Muhammad Amir Yousaf
Bode diagram for multiple stage filter Kent Bertilsson Muhammad Amir Yousaf
Bode diagram for multiple stage filter Kent Bertilsson Muhammad Amir Yousaf
Bode diagram Kent Bertilsson Muhammad Amir Yousaf
Bode diagram Kent Bertilsson Muhammad Amir Yousaf
Exercise R R2 C VIn R3VOut • Draw an asymptotic bode diagram for the shown filter. Kent Bertilsson Muhammad Amir Yousaf
Amplifier • Voltage amplification • Current amplification • Power amplification IIN IOut PIN VIn VOut POut Kent Bertilsson Muhammad Amir Yousaf
Amplifier model • The amplifier model is often sufficient describing how an amplifier interacts with the environment • RIn – Input impedance • AV – Voltage gain • ROut – Output impedance ROut VIn RIn AVVIn VOut Kent Bertilsson Muhammad Amir Yousaf
Amplifier model Kent Bertilsson Muhammad Amir Yousaf
Bandwidth • The bandwidth is the frequency range where the transferred power are more than 50%. H(f) AVmax 0.707AVmax f1f2f Kent Bertilsson Muhammad Amir Yousaf
Distortion • A nonlinear function between UIn and UOut distorts the signal • An amplifier that saturates at high voltages • A diode that conducts only in the forward direction Kent Bertilsson Muhammad Amir Yousaf
Noise • Random fluctuation in the signal • Theoretically random noise contains all possible frequencies from DC to infinity • Practical noise is often frequency limited to an upper bandwidth by some filter • A limited bandwidth from the noisy reduce the noise power Kent Bertilsson Muhammad Amir Yousaf
RC Filters in Mindi • Design a RC filter in Mindi. • Simulate output for diffrentfrequencies • Analyse the results. • dB • Bode Plots Kent Bertilsson Muhammad Amir Yousaf