Download
1 / 27
270 likes | 445 Vues
Biofuels, Price Increases, and Land Use*. Peter Berck Univ. Calif. Berkeley * I thank, without implicating, Max Auffhammer , Catie Hausman, Sarah Lewis, and Lunyu Xie . Crop Utilization for Biofuels Has Gone UP. US Ethanol Production: Millions of Gallons. Perspective.

E N D
Biofuels, Price Increases, andLand Use* Peter Berck Univ. Calif. Berkeley *I thank, without implicating, Max Auffhammer, Catie Hausman, Sarah Lewis, and LunyuXie.
Perspective • Record ethanol production (written in ’08/’09) drove the year-to-year increase for total FSI (including ethanol) use. • Estimated corn use for ethanol was 3,677 million bushels, up 628 million from the previous year. • And it went up more from there.
See the near doubling of the real prices of corn and soy? Whoever did this committed a crime against humanity.
Even with the recent run up, food has never been cheaper.
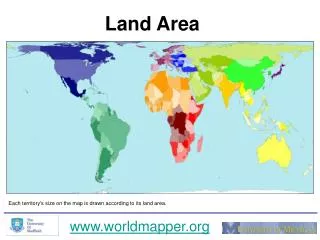
1960-2009 Percent of Land in CropsDoesn’t look like a big biofuel bump…
Therefore Biofuels CAUSED High Prices and More Crop Land Not so fast…. • Clearly there is more work to be done here. • Comment: Most of what is going on in the world crop economy was going on before and after biofuels. Higher yields is the big story. Higher demand is the emerging story. But neither of these is the biofuel story.
Getting some pretty direct evidence from the data • The usual method is to specify supply and demand for everything in the world. Or just all the worlds crops. Put this in a model. • Ask your model, suppose some land went off and grew biofuels instead. • Model will give answer that depends upon elasticities of supply and demand and everything else in the model
Alternative • Truly Tiny Models. • Step 1. from land to price. A regression. • Step 2. from price to land. Another regression
Step 1: Pin the Price Rise on the Ethanol • We use US data to find the relations among US cropland and prices • We account for everything else on the planet, too.
Data • US production of corn and soy • Yearly from 1956-2007 • Farmland, cropland, farmgate crop prices, futures crop prices • Input prices, foreign production, loan rates
We regress a bunch of these variables on their lags • And use the structure, e.g. that acreage decisions are based on spring futures prices to find the relationships among the variables. • Technically this is an SVAR (see Auffhammer, Berck, Hausman for details)
To Estimate a system that looks like Here A and A1 are matrices; A has lots of zeros but that is a longer story. C is also a matrix. These are all matrices of coefficients. In this example they are 5x5 because there are 5 variables in Y and therefore 5 equations. X are things like input prices. The e we leave to an econometrics class. We use the data to find the values of the A’s and C.
Now we simulate. • We see what our system says prices will be with the existing corn acreage. We take this years acreage and ask what will be next years prices • Now we do it again with less acreage. We take this years acreage, less a million acres, and ask what next years prices will be. • The change in price / change in acres is how much prices go up when acres devoted to food go down.
Results • $0.04 to $0.07 increase in corn price for every 1 million corn acre shock • From 2006 to 2007, acreage of corn going to ethanol increased by 6 million • Price increased $0.80 • Then 30 to 50% of the price increase is explained by 2007 ethanol production, in our model • Soybean prices also increase.
Hausman: Brazil • soy spot price doubles, • soy acreage increases 26 percent nationally. • soybean futures doubles, • soy acreage increases 63 • This increase is higher in regions of ecological importance; • soy spot and futures prices double, • soy acreage increases 390 percent in the Center-West and • 320 percent along the border of the Amazon.
Rough Calculation • 1/3 of price increase from biofuels • Price went from about $5 to about $10 • So 1/3 of a double • So about 30% acreage increase in Brazil, if the price increase were permanent • About 9% if temporary.
Lessons • So far, the big driver of world land use is not biofuel. • The place not to look for a difference is where cropland is already pretty well maxed out (south asia, US) • Biofuel does make a difference. The place to look for the difference is the place where cropland is expanding anyway. Brazil. Measureable land change does come from use for biofuel
Addenda • The research project known as EBI seeks to get more biofuel per acre. • Biofuel requirements held constant, discovery lowers price and land use.