Download
1 / 29
300 likes | 464 Vues
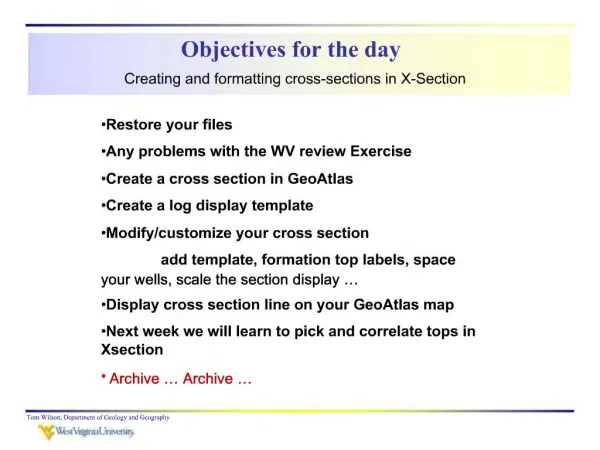
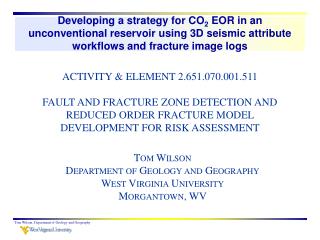
Objectives for the Day. General review seismic stratigraphy exercises Lithic surfaces versus reflection events Edge enhancement and detection Some additional conceptual diagrams illustrating deposition under cycles of eustatic sea level rise and fall The Woodbine play Synthetic tie

E N D
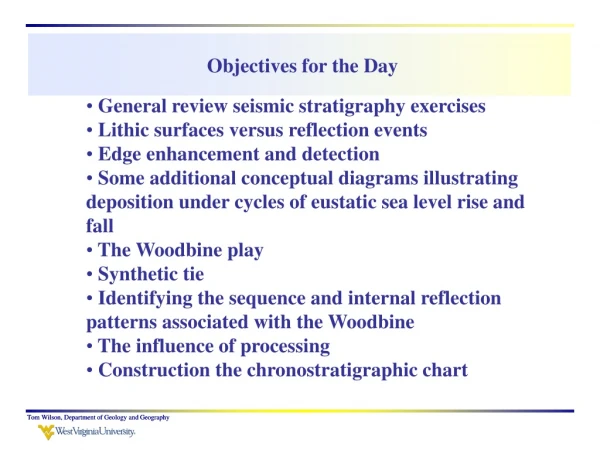
Objectives for the Day • General review seismic stratigraphy exercises • Lithic surfaces versus reflection events • Edge enhancement and detection • Some additional conceptual diagrams illustrating deposition under cycles of eustatic sea level rise and fall • The Woodbine play • Synthetic tie • Identifying the sequence and internal reflection patterns associated with the Woodbine • The influence of processing • Construction the chronostratigraphic chart Tom Wilson, Department of Geology and Geography Tom Wilson, Department of Geology and Geography
Island Platform, Deep Water, Southern Bahamas Tom Wilson, Department of Geology and Geography
some comments on the preceding section In the preceding section, the platform lies to the left. The prominent seismic sequence to the right appears as a simple wedge of sediments dipping down to the right which is in turn onlapped by flatter lying sediments. Closer inspection reveals several distinct intervals of onlap belonging to at least three different sequences. The section reveals an earlier prograding sequence that was extensively eroded and itself followed by additional onlap against the escarpment to the left. Subtle downlap and onlap mark locations of smaller sequences within the latest package that extends to the water bottom. The pattern suggests presence of an earlier high stand system followed by significant sea level drop and then by gradual and relatively steady sea level rise Tom Wilson, Department of Geology and Geography
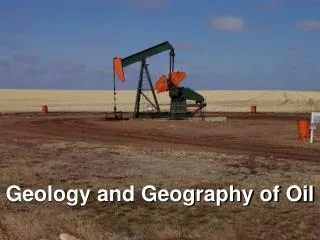
Baltimore Canyon, East Coast, US Prograding clinoforms/oblique Erosional Truncation A combination of prograding clinoforms followed by sealevel drop and coastal onlap (3 and above) overlie a thick sequence characterized by predominantly parallel reflection events with some local onlap (1) above a deeper erosional inconformity Tom Wilson, Department of Geology and Geography
National Petroleum Reserve, Alaska Sigmoid clinoforms Tom Wilson, Department of Geology and Geography
National Petroleum Reserve, Alaska Sigmoid clinoforms • Some questions to contemplate: • What was the bathymetric relief between the top and base of the prograding wedge? • Was the wedge building upward, outward, or a combination of the two? • What caused the reflectors on the left (4) to become hump shaped? Tom Wilson, Department of Geology and Geography
Central Atlantic Shelf, near the Baltimore Canyon Prograding clastic wedge The reflectors to the right of 1) build both out and up. The internal configuration is oblique (left) to sigmoid (near 1) and then oblique again. The environment is prograding shelf margin. Tom Wilson, Department of Geology and Geography
Splay, Floodplain, & Channel Environments F37 Event Manual pick of the F37 Lithic surface Flattened on the F37 reflection event Tom Wilson, Department of Geology and Geography
Splay, Floodplain, & Channel Environments The F37 “stratal” time surface Hardage et al. (1994) Tom Wilson, Department of Geology and Geography
Enhancing Discontinuities to Resolve Depositional and Structural Features "Edge" Detection Processing Results from an analysis of coherency between events in the seismic data set Bahorich and Farmer, 1995 Tom Wilson, Department of Geology and Geography
Schlumberger’s Ant Tracking Process Tom Wilson, Department of Geology and Geography
General background on the Woodbine Upper Cretaceous shoreline deposits USGS Fact Sheet Tom Wilson, Department of Geology and Geography
Sea Level Rise and Fall Posamentier and Vail, 1985 Tom Wilson, Department of Geology and Geography
Identifying the Woodbine reflection events using a synthetic seismic tie Dynamite source Tom Wilson, Department of Geology and Geography
Synthetic Seismogram The Ogletree #1 Reflection coefficient train sonic No impedance composite - + Austin Chalk Eagleford Shale Top of the Woodbine Buda Limestone Tom Wilson, Department of Geology and Geography
Ogletree #1 Austin Eagle Fd. Woodbine Buda Seismic Response of the Woodbine Stricklin, 2007 Tom Wilson, Department of Geology and Geography
Identifying the Woodbine Sequence Tom Wilson, Department of Geology and Geography
The Woodbine Seismic Sequence 1 2 3 4 5 Where do intervals 1 through 5 fall on the relative depositional time scale? Tom Wilson, Department of Geology and Geography
http://homepage.ufp.pt/biblioteca/GlossarySaltTectonics/Pages/PageD.htmlhttp://homepage.ufp.pt/biblioteca/GlossarySaltTectonics/Pages/PageD.html Tom Wilson, Department of Geology and Geography
Seis Strat Exercise Stratigraphic (Depth) Chronostratigraphic Tom Wilson, Department of Geology and Geography
Seis Strat Exercise Start working on the Woodbine sequence and hand in next Wednesday Tom Wilson, Department of Geology and Geography
The influence of processing on the interpretation. 1970s versus 1997 – which is better? Older 1970s processing Newer processing flow. Better or worse? Tom Wilson, Department of Geology and Geography
Migration before or after Migration after stacking Migration before stacking provides a slightly better view of internal prograding intervals Tom Wilson, Department of Geology and Geography
What you see is not necessarily what you get post-stack migration Basic lesson is that processing flow can influence what you see in your section and thus your geologic interpretation pre-stack migration Tom Wilson, Department of Geology and Geography
1 2 3 4 5 Seismic Stratigraphy Exercise Identify internal subdivisions. Use lapout and truncation relationships to establish subdivisions. Consider the relationship between sediment supply and sea level rise during deposition of these sediment packages. Tom Wilson, Department of Geology and Geography
1 2 3 4 5 Seis Strat Exercise Chronostratigraphic Section ? ? 87 Mya 3 4 89 Mya 91 Mya 2 93 Mya 1 95 Mya 5 97 Mya Global sea level curves from Vail and Mitchum Tom Wilson, Department of Geology and Geography
To do • Hand in the initial seismic sequence interpretations. • Complete the construction of the chronostratigraphic chart and hand in ….. Tom Wilson, Department of Geology and Geography Tom Wilson, Department of Geology and Geography