Download
1 / 15
150 likes | 276 Vues
PLASMA TRANSPORT ALONG DISCRETE AURORAL ARCS. Kullen 1 , T. Johansson 2 , S. Buchert 1 , and S. Figueiredo 2. 1 Swedish Institute of Space Physics, Uppsala 2 School of Electrical Engineering, KTH, Stockholm. AGU Fall Meeting, San Francisco, December 2007. INTRODUCTION.

E N D
PLASMA TRANSPORT ALONG DISCRETE AURORAL ARCS • Kullen 1, T. Johansson 2, S. Buchert 1, and S. Figueiredo 2 1 Swedish Institute of Space Physics, Uppsala 2 School of Electrical Engineering, KTH, Stockholm AGU Fall Meeting, San Francisco, December 2007
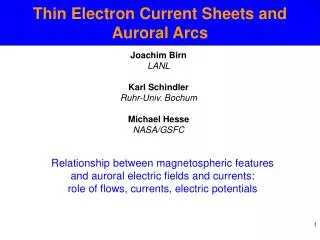
INTRODUCTION • Common features of static discrete auroral arcs are: field-aligned potential drop and strong perpendicular E-field above. • Due to the field-parallel E-fields, the region above the acceleration region is partly decoupled from the ionosphere and strong, local plasma flows along the auroral arc are the consequence. Haerendel et al. (1996) AIM OF THE STUDY: The role of rapid plasma flows connected to intense E-fields for the large-scale plasma convection is investigated.
INTRODUCTION Haerendel (1992, 2000, 2002) proposed: The east-west extension of auroral arcs indicates a connection with the global convection system. A filamentation of the plasma sheet and field-aligned currents results in discrete auroral arcs. The strong plasma flows connected to the arcs will contribute considerably to the large-scale plasma convection. The discretization is a more effective way of magnetospheric pressure release, as the locally enhanced plasma convection helps to remove magnetospheric stresses from the source region, i.e., discrete arcs serve as “auroral pressure valves”. From Härendel (2000) After Boström (1964)
DATA SELECTION • The work is based on Cluster electric field (EFW instrument) and density data (CIS instrument and spacecraft potential). • The dataset consists of 32 veryintense E-field events that occur 4-7 Re above the ionosphere with mapped electric field magnitudes of 500-1000 mV/m. • The events analyzed here are a subset from a statistical study by Johansson et al. (2006). Only those events have been taken into account where data is available for an extended period of time.
CLUSTER PASSAGES ABOVE THE IONOSPHERE Cluster coverage of 4-7 Re during 2001-2003 Due to Clusters orbit (apogee at 4 Re maps to 62 degrees CGlat), mainly the high-latitude part of the auroral oval is covered. Johansson et al. (2005)
Cluster passages containing E-peaks > 500 mV/m number of events Strong E-peaks > 150 mV/m E-field magnitude (mV/m) (This study) Johansson et al. (2005) E-PEAK DISTRIBUTION ALONG THE OVAL The majority of extremely strong E-peak events appears in the pre-midnight region. The dawnside oval is nearly devoid of extremely strong E-peak cases (see also Newell et al., 1996). Strong E-field events (>150 mV/n) are mainly found at 70-75 deg CGlat. Extremely strong E-field events (> 500 mV/m) appear on lower latitudes.
THE DIRECTION OF BACKGROUND PLASMA FLOW DURING INTENSE E-PEAK EVENTS • The average plasma flow during Cluster passages containing intense E-peaks is in 14 cases sunward and in 18 cases antisunward. • Most sunward flow events appear on the nightside oval. • Anti-sunward flow events appear everywhere except at dawn.
BACKGROUND PLASMA FLOW DURING E-PEAK EVENTS: DEPENDENCE ON SUBSTORM PHASE Most strong E-peak events appear during active times: E-peaks during substorms: 30 events E-peaks during quiet times: 2 events Substorm expansion and main phase (increasing or max AE): E-peak events at nightside, with sunward background flow. Substorm recovery and quiet times (decreasing or low AE): E-peak events at dusk and dayside, with anti-sunward background flow.
auroral arc high-density region low-density region density E-field particle flux NET PLASMA TRANSPORT CONNECTED TO STRONG E-PEAKS • Plasma flows connected to discrete arcs are directed in opposite directions on the different sides of the arc. • A net plasma transport occurs only when the connected E-peak is nearly monopolar or the arc is located at a density gradient.
monopolar E-field bipolar E-field E^ j// n weak density gradient steep density gradient Johansson et al. (2006) show: Monopolar E-field structures are connected to steep density gradients. Bipolar E-field structures are connected to weak density gradients. NET PLASMA TRANSPORT CONNECTED TO STRONG E-PEAKS Johansson et al. (in press) show: • Most intense E-field events appear at plasma boundaries. • Monopolar E-peaks are 4 times more common than bipolar E-peaks. As suggested in Marklund et al. (2004) monopolar E-peaks occur as the density is not high enough on the low-density side to support connecting field-aligned currents.
EXAMPLE 1:April 15, 2002 event • Two broad, nearly monopolar E-field structures appear near the PC boundary of the dusk oval. • One of the nearly monopolar E-peaks appears in connection with a density maximum. This leads to an important net plasma transport in anti-sunward direction. • The particle flux connected to the strongest E-peak contributes significantly to the total plasma transport in the plotted oval region (see integrated flux curve). E-field flux flux density
EXAMPLE 2:April 27, 2002 event • A strong, narrow E-field peak appears in the high-latitude part of the dusk oval. • It causes a plasma transport in anti-sunward direction. The background flux is in sunward direction. • The plasma transport connected to the E-peak is negligible compared to the total flux across the plotted oval region. • Reason: the E-peak is too narrow to play an important role for the total plasma transport. E-field flux flux density
THE INFLUENCE OF STRONG E-PEAKS ON THE TOTAL PLASMA TRANSPORT Results: 2/3 of all strong E-peaks are in same direction as background flux Only 1/3 of all strong E-peaks contribute much to the background convection
Potential versus E-peak width E-peak magnitude versus E-peak width Number of events versus E-peak magnitude Johansson et al. (Ann. Geophys., in press) E-PEAK CONTRIBUTION TO PLASMA TRANSPORT:WHY FILAMENTATION DOES NOT WORK • The magnitude of intense E-field events is inversely proportional to the E-peak width (scalesize S(E)). • The potential is only weakly increasing (nearly constant) up to a scale size of 13 km Conclusion: A filamentation of the E-field into narrow structures does in most cases not lead to an enhanced net plasma transport.
SUMMARY 32 strong E-field peaks above 500 V/m are examined that are measured by the Cluster satellites when they are 4-7 Re above the Earth. Due to the Cluster obits the examined E-peaks appear all on 65 deg latitude or higher. • For the studied intense E-field events, the background flow during expansion is in most cases sunward, during recovery in most cases anti-sunward. • In 2/3 of all cases the net plasma flux connected to strong E-peaks is in the same direction as the background flow. • In only 1/3 of all cases, the plasma flux caused by the E-peak makes an important contribution to the plasma transport. The reason is the narrow width of high E-peaks. This questions the role of discrete auroral arcs as major drivers of plasma convection.