Download
1 / 1
10 likes | 93 Vues
Investigating gross margin trends of 6 payers over 4 years at a community pharmacy in Iowa, revealing significant declines and variations, impacting generic versus brand prescriptions.

E N D
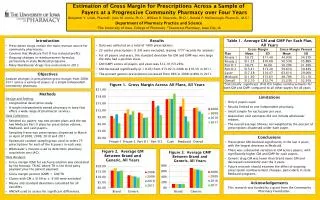
Limitations Only 6 payers used. Results limited to one independent pharmacy. Small sample for each payer per year. Acquisition cost estimates did not include wholesaler rebates. The overall average GM was not weighted by the percent of prescriptions dispensed under each payer. Results Data was collected on a total of 1800 prescriptions 23 outlier prescriptions (1.3%) were excluded, leaving 1777 records for analysis For all payers and years, the standard deviation for GM and GMP was very large the data had a positive skew. GM (GMP) across all payers and years was $12.10 (53.23%). GM decreased significantly (p < 0.05) from $13.02 in 2008 to $10.59 in 2011. The percent generic prescriptions increased from 69% in 2008 to 80% in 2011. Acknowledgements This research was funded by a grant from the Community Pharmacy Foundation . Methods Design and Setting: Longitudinal descriptive study. A single independently owned pharmacy in Iowa that offers a wide range of pharmacist services. Data Collection: Selected six payers: top two private plans and the top two Medicare Part D plans by prescription volume, Medicaid, and cash payers. Sampling frame was prescriptions dispensed in March or April of 2008, 2009, 2010 and 2011. Systematic random sampling was used to select 75 prescriptions for each of the 6 payers in each year. Wholesaler’s invoices used to determine pharmacy acquisition cost (AC). Data Analysis: Gross margin (GM) for each prescription was calculated by the formula: TR-AC where TR is the third party payment plus the patient payment. Gross margin percent (GMP) = GM/TR Claims with GM ≥ $100 or ≤ -$100 were excluded Means and standard deviations calculated for all variables. ANOVA used to assess for significant differences. Objectives Analyze changes in prescription gross margin from 2008-2011 across a variety of payers at a single independent community pharmacy. Introduction Prescription drugs remain the main revenue source for community pharmacies. Concern that Medicare Part D has reduced profits. Ongoing changes in reimbursement formulas, particularly in state Medicaid programs. Many blockbuster drugs lose exclusivity in 2012. Estimation of Gross Margin for Prescriptions Across a Sample of Payers at a Progressive Community Pharmacy over Four Years Benjamin Y. Urick, PharmD1, Julie M. Urmie, Ph.D.1, William R. Doucette, Ph.D.1, Randal P. McDonough, Pharm.D., M.S.2 Department of Pharmacy Practice and Science 1The University of Iowa, College of Pharmacy 2Towncrest Pharmacy, Iowa City, IA Conclusions Prescription GM declined significantly in the last 4 years, with the largest decrease in Medicaid. There was substantial variation in GM across payers, with significantly higher GM and GMP for cash payers. Generic drug GM was lower than brand name GM and decreased consistently over the 4 years. Future research should examine the effect of ongoing prescription reimbursement changes, particularly in state Medicaid programs.