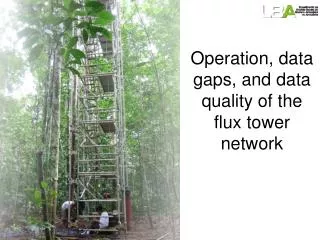
Intercomparison of Software for Flux Measurement Quality Control at LBA Tower Sites
450 likes | 587 Vues
This document details the findings from the LBA (Large-scale Biosphere-Atmosphere) workshop held in December 2001, focusing on the intercomparison of software utilized in flux measurement quality control. It addresses key issues such as flux sampling problems, effects of surface heterogeneity, and correction for random and systematic errors. Results include insights on sensitivity analyses, the necessity for rigorous quality controls, and recommended practices for spike removal and amplitude resolution. The paper serves as a pivotal resource for researchers involved in flux measurement and analysis in varying terrains.

Intercomparison of Software for Flux Measurement Quality Control at LBA Tower Sites
E N D
Presentation Transcript
LBA Flux Tower Workshop Software Intercomparison Celso von Randow Ganabathula Prasad CPTEC/INPE December 2001
Quality control – Vickers & Mahrt (1997) Software intercomparison • Flux sampling problems – Mahrt (1998) • Surface heterogeneity, complex terrains • Nonstationarity • Random Flux Errors • Systematic underestimation of low frequency fluxes • Sensitivity of flux calculations • Results of intercomparison among LBA flux measurements
Spike Removal Insufficient Amplitude Resolution Drop outs Absolute Limits Skewness and Kurtosis Discontinues- Haar mean, Haar var. Lag Correlation – Not used. Vertical Profile – Not used. Quality control for Sonic Data
Electronic spikes to have a max. width of 3 consecutive points in the time series and more than 3.5 standard deviations from the window mean (L=3000 points =5min@10Hz) The point is replaced using linear interpolation between data points. The record is flagged when the total number of spikes replaced exceeds 1% of the total number of data points Spike Removal
Compute a series of discrete frequency distributions for half-overlapping windows of length 1,000 data points The window move one-half the window width at a time through the series the number of bins is 100 and the interval for the distribution is min(range, 7). Flagged if number of empty bins in the discrete frequency distribution >70% Insufficient Amplitude Resolution
Consecutive points that fall into the same bin are tentatively identified as dropouts Max no of consecutive dropouts as % of total window points same window and frequency distributions used for the resolution problem if bin is within 10% and 90% tentiles of distribution, compare with threshold. Drop outs
|u|> 30 m/s |v| > 30m/s |w| > 5 m/s T < 275 K (2 C) & T> 323 K (50 C) H2O< 2 & H2O> 40 g/kg Absolute Limits
Detrend record Skewness [-2 2] (Empirical value) Kurtosis [1 8] (Empirical value) Skewness and Kurtosis
Haar transform of window Normalize with the smallest S.D. Discontinuity if Haar mean >3 Discontinuites
Systematic Error: failure to capture all the largest transporting eddies– underestimation of flux. Random Error: Inadequate sampling of main transporting eddies, inadequate record size. Mesoscale variability: inhomogeneity of flow. Dependence of flux on choice of scale. Flux Sampling Errors
Relative Systematic Error: < w’’>L2 - < w’’>L1 < Th < w’’>L1 Systematic Error
Partition record into non overlapping subrecords (i=1,2,…) Average Flux Fi=<Fi> +Ftr + F*i Ftr = a0 + a1t using a Least Squares fit. RFE = F* |<Fi>| -1 N-0.5 RN = Ftr|<Fi>| -1 N-0.5 Random Error
Measure of Isolated flux event: Max(Fi) |<Fi>| -1 Fi is the aver sub-record flux <Fi> is the record mean value of Fi Flux Event
No of Records 44 RFE RN EVT RSE FSR WU 5 3 48 1 0 WV 45 9 48 34 15 WT 6 5 48 3 0 WH2O 18 6 48 11 0 Preliminary Results on Santarem km67Day 267
Averaging time scales Rotations Block averaging / Linear detrending / Recursive digital filter Low frequency corrections Uncertainties Sensitivity of flux calculations
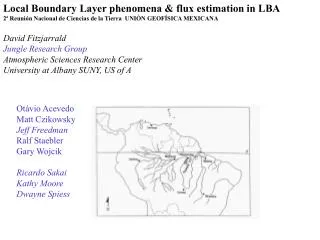
LBA tower sites • Rondônia • Rebio Jaru forest – Primary forest • Fazenda Nossa Senhora) - Pasture • Manaus • Tower K34 – Primary forest • Tower C14 – Primary forest • Santarém • Tower Km 67 – Primary forest • Tower km 83 – Logged forest (primary) • Tower km 77 – Pasture site
LBA tower sites • Caxiuanã • Primary forest • Brasília • Cerrado • Campo Sujo (Biennial fire regime) • Campo Sujo (Quadriennial fire regime) • Mato Grosso • Sinop Forest • Bragança • Mangrove • Venezuela – Savanna site
Softwares used in intercomparison • Vickers & Mahrt Software (Oregon St. Univ.) • 2 rotations; • Block averaging • Discard records with high random flux errors and nonstationarity + Softwares used in LBA flux sites • Rondônia, Manaus – EddyWSC v.2 (Alterra) • 3 rotations; • Digital recursive filter (800 s time constant); • Low frequency corrections
Santarém, km 83 – EddyWSC v.1 (Alterra) • 3 rotations; • Digital recursive filter (200 s time constant); • Santarém, km 67 – CD-10 Program (Harvard Univ.) • Santarém, Pasture – CD-03 Program (ASRC, Albany) • Caxiuanã – Edisol (Univ. of Edinburgh) • Brasília – EddySoft package (MPI) • 3 rotations; • Linear detrending; • Venezuela – Edisol (Univ. of Edinburgh)
CD-10 x Vickers & Mahrt Software ~ dry season
200 s x 800 s time constant CD-04 x EddyWSC
Eddysoft package x EddyWSC ~ dry season
Fluxes calculated by different LBA groups might give quite different values specially considering different parameters (averaging time scale; corrections; etc) In summary... • As fluxes calculations in complex terrains are very sensitive to parameters like rotations and averaging time scales, LBA groups should be VERY CAREFUL when integrating or comparing measurements from different groups. • Softwares used by a few groups (Rondonia/Manaus, Santarém km 67, Caxiuanã/Bragança) agree within + 6 %. • Softwares used by groups CD-03, CD-04, Brasilia and Venezuela calculated substantially lower fluxes than other programs (averaging time scales ? corrections ? )
Jair F. Maia Maria Betânia L. de Oliveira Paulo Kubota Acknowledgements
Continue software intercomparison Put together a “golden” data set that can be run by each group on their own program; Suggestions for (near) future • Integration of measurements on large scale • Standardize software parameters ? • How do the differences are reflected in long term budgets ? • Are the differences the same in positive (respiration) and negative (assimilation) fluxes ?