Statistical Inference in Management: Exam Study Guide
This document serves as a comprehensive study guide for the Statistical Inference in Management course (MGMT 276). It outlines essential topics from Chapters 5-11 of the Lind textbook and Chapters 10, 11, 12, and 14 of the Plous textbook. Key concepts include probability distributions, hypothesis testing, estimation, and confidence intervals. It also offers guidance on calculating z-scores, interpreting significance levels, and solving problems related to normal distributions. Ensure to review all materials thoroughly in preparation for the upcoming exam.

Statistical Inference in Management: Exam Study Guide
E N D
Presentation Transcript
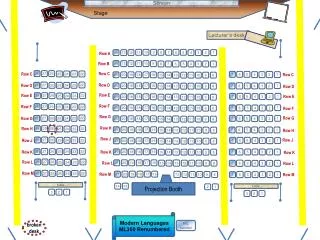
Stage Screen Lecturer’s desk 11 10 9 8 7 6 5 2 14 13 12 4 3 1 Row A 14 13 12 11 10 9 6 8 7 5 4 3 2 1 Row B 28 27 26 23 25 24 22 Row C 7 6 5 Row C 2 4 3 1 21 20 19 18 17 16 13 Row C 15 14 12 11 10 9 8 22 27 28 26 25 24 23 Row D 1 Row D 6 21 20 19 18 17 16 13 7 5 4 3 2 15 14 12 11 10 9 8 Row D Row E 28 27 26 22 Row E 23 25 24 7 6 5 1 2 4 3 Row E 21 20 19 18 17 16 13 15 14 12 11 10 9 8 Row F 28 27 26 23 25 24 22 Row F 1 6 21 20 19 18 17 16 13 7 5 4 3 2 15 14 12 11 10 9 8 Row F Row G 22 27 28 26 25 24 23 7 6 5 1 Row G 2 4 3 Row G 21 20 19 18 17 16 13 15 14 12 11 10 9 8 Row H 28 27 26 22 23 25 24 Row H 6 21 20 19 18 17 16 13 7 5 4 3 2 1 15 14 12 11 10 9 8 Row H Row J 28 27 26 23 25 24 22 7 6 5 Row J 2 4 3 1 Row J 21 20 19 18 17 16 13 15 14 12 11 10 9 8 22 27 28 26 25 24 23 6 21 20 19 18 17 16 13 7 5 4 3 2 1 15 14 12 11 10 9 8 Row K Row K Row K 28 27 26 22 23 Row L 25 24 21 20 19 18 17 16 13 6 15 14 12 11 10 9 8 Row L 7 5 4 3 2 1 Row L 28 27 26 22 23 Row M 25 24 21 20 19 18 17 16 13 6 12 11 10 9 8 Row M 7 5 4 3 2 1 Row M table • Projection Booth 14 13 2 1 table 3 2 1 3 2 1 Modern Languages ML350 Renumbered R/L handed broken desk
Please click in My last name starts with a letter somewhere between A. A – D B. E – L C. M – R D. S – Z
MGMT 276: Statistical Inference in ManagementRoom 350 Modern LanguagesSpring, 2012 Welcome
Exam 2 March 20th Please read: Chapters 5 - 11 in Lind book & Chapters 10, 11, 12 & 14 in Plous book: Lind Chapter 5: Survey of Probability Concepts Chapter 6: Discrete Probability Distributions Chapter 7: Continuous Probability Distributions Chapter 8: Sampling Methods and CLT Chapter 9: Estimation and Confidence Interval Chapter 10: One sample Tests of Hypothesis Chapter 11: Two sample Tests of Hypothesis Plous Chapter 10: The Representativeness Heuristic Chapter 11: The Availability Heuristic Chapter 12: Probability and Risk Chapter 14: The Perception of Randomness
Use this as your study guide By the end of lecture today2/28/12 Estimation Confidence Intervals using z scores Standard Error of the Mean (SEM) Logic of hypothesis testing Steps for hypothesis testing Levels of significance (Levels of alpha) what does alpha of .05 mean? what does p < 0.05 mean? what does alpha of .01 mean? what does p < 0.01 mean? Type I vs Type II Error
Homework due - (March 1st) On class website: please print and complete homework worksheet #9 Please double check – Allcell phones other electronic devices are turned off and stowed away
z scores ? ? From raw scores to percent/area get z score z-table (from z to area) Distance from the mean ( from raw to z scores) z score = raw score - mean standard deviation Raw Scores (actual data) Proportion of curve (area from mean) From percent scores to raw scores get z score from table raw score = mean + (z score)(standard deviation) From percent scores to raw scores bordering middle of curve get z score from table raw scores = mean ± (z)(standard deviation) 95%
? ? Mean = 50Standard deviation = 10 Find the scores for the middle 95% 95% x = mean ± (z)(standard deviation) z-table (from z to area) Distance from the mean ( from raw to z scores) .9500 Raw Scores (actual data) Proportion of curve (area from mean) .4750 .4750 ? Remember: When we are looking for the score from proportion we use the z-table ‘backwards’. We find the closest z to match our proportion Middle 95% z = 1.96
? ? Mean = 50Standard deviation = 10 Find the scores for the middle 95% 95% x = mean ± (z)(standard deviation) .9500 .4750 .4750 ? 1) Go to z table - find z score for for area .4750 Please note: When we are looking for the score from proportion we use the z-table ‘backwards’. We find the closest z to match our proportion z = 1.96
? ? Mean = 50Standard deviation = 10 Find the scores for the middle 95% 95% x = mean ± (z)(standard deviation) .9500 .4750 .4750 ? 1) Go to z table - find z score for for area .4750 z = 1.96 Please note: When we are looking for the score from proportion we use the z-table ‘backwards’. We find the closest z to match our proportion
? ? Mean = 50Standard deviation = 10 Find the scores for the middle 95% 95% x = mean ± (z)(standard deviation) 30.4 69.6 The scores 30.4 - 69.6 capture the middle 95% of the curve .9500 .4750 .4750 Please note: We will be using this same logic for “confidence intervals” ? 1) Go to z table - find z score for for area .4750 z = 1.96 2) x = mean + (z)(standard deviation) x = 50 + (-1.96)(10) x = 30.4 30.4 3) x = mean + (z)(standard deviation) x = 50 + (1.96)(10) x = 69.6 69.6
Estimating the mean of a population On average newborns weigh 7 pounds, and are 20 inches long.My sister just had a baby - guess how much it weighs? - guess how long it is Point estimate: a single number that represents your best guess at a single value in an unknown population (use measure of central tendency, like the mean) Makes sense, right?!? Guess the mean. On average you would be right most often if you always guessed the mean
Point estimate: a single number that represents your best guess at a single value in an unknown population • This sample of 10,000 newborns • a mean weight is 7 pounds. What do you think the mean weight of a random sample of 10 newborns would be? Without more info, on average you would be right most often if you always guessed the mean • This sample of 500 households produced • a mean income of $35,000 a year. What do you think the mean income of Mabel is? • This sample of 1000 kids had a mean IQ of 100. What do you think the mean of all kids is? If you didn’t know Miguel, what would you guess his IQ to be?
Problem with point estimate Mean kids IQ of 100. Mean income of $35,000 a year. Mean weight 7 pounds. Are we right always? - no How close is our estimation? - what other information about these distributions would we want to know? Variability! Which of these distributions would allow our guess to be closest to what’s right?
Estimating the mean of a population 95% 2.5% 2.5% On average newborns weigh 7 pounds, and are 20 inches long.My sister just had a baby - guess how much it weighs? - guess how long it is What if you really needed to be right?!!? You could guess a range with min and max scores. (how wide a range to be completely sure? 7 pounds
Point estimate: a single number that represents your best guess at a single value in an unknown population 95% Confidence Interval: We can be 95% confident that our population mean falls between these two scores 99% Confidence Interval: We can be 99% confident that our population mean falls between these two scores Which has a wider interval relative to raw scores?
Confidence intervals Can actually generate CI for any confidence level you want – these are just the most common Confidence Intervals (based on z): A range of values that, with a known degree of certainty, includes an unknown population characteristic, such as a population mean • The interval refers to possible values of the population mean. • We can be reasonably confident that the population mean • falls in this range (90%, 95%, or 99% confident) • In the long run, series of intervals, like the one we • figured out will describe the population mean about 95% • of the time.
Confidence Intervals (based on z): A range of values that, with a known degree of certainty, includes an unknown population characteristic, such as a population mean • How can we make our confidence interval smaller? • Decrease level of confidence • Decrease variability through more careful assessment • and measurement practices (minimize noise) • Increase sample size (This will decrease variability too) . 95% 95%
Confidence Intervals (based on z): A range of values that, with a known degree of certainty, includes an unknown population characteristic, such as a population mean Choosing a Confidence Level A higher confidence level leads to a wider confidence interval. Greater confidence implies loss of precision.(95% confidence is most often used) . 95% 95%
? ? Mean = 50Standard deviation = 10 n = 100 s.e.m. = 1 Confidence intervals σ 95% standard error of the mean = Find the scores for the middle 95% n √ 48.04 51.96 For “confidence intervals” same logic – same z-score But - we’ll replace standard deviation with the standard error of the mean .9500 .4750 .4750 ? 10 = 100 √ x = mean ± (z)(s.e.m.) x = 50 + (1.96)(1) x = 51.96 95% Confidence Interval is captured by the scores 48.04 – 51.96 x = 50 + (-1.96)(1) x = 48.04
Confidence intervals Level of Alpha = .10 = .05 = .01 Construct a 95 percent confidence interval around the mean Tell me the scores that border exactly the middle 95% of the curve - use z score of 1.96 2.58 z scores for different levels of confidence 1.960 1.64 90% How do we know which z score to use?
Confidence intervals ? ? σ standard error of the mean 95% = n √ Mean = 50 Standard error mean = 10 Hint always draw a picture! Tell me the scores associated that border exactly the middle 95% of the curve We know this raw score = mean ± (z score)(standard deviation) Construct a 95 percent confidence interval around the mean Similar, but uses standard error the mean raw score = mean ± (z score)(standard error of the mean)
σ raw score = mean + (z score)(standard deviation) standard error of the mean = mean = 50 standard error of the mean = 10 n √ In words raw score = mean + (z score)(sem) If we go up nearly two standard errors of the mean z score = +1.96 and raw score = 69.6 If we go down nearly two standard errors of the mean z score = -1.96 and raw score = 30.4 In symbols raw score = mean + (z score)(sem) x = x + (z)(σx) or 50 + (1.96)(10) = 69.6 50 + (-1.96)(10) = 30.4
µ Let’s do one raw score = mean ± (z score)(s.e.m.) σ= 32 σ 32 95% = n n= 16 √ √ 16 σ 20 x± z z = 1.96 z = -1.96 n x= 20 √ 32 = 20 ± (1.96) 16 √ 32 = 20 ± (1.96) = 20 ± (1.96)(8) = 20 ± 15.68 = 4.32 < µ < 35.68 4 σ= σ= 8 σ x x x
µ Let’s do one raw score = mean ± (z score)(s.e.m.) σ= 32 σ 32 95% = n n= 16 √ √ 16 σ 20 x± z z = 1.96 z = -1.96 n x= 20 √ 32 = 20 ± (1.96) 16 √ 32 = 20 ± (1.96) = 20 ± (1.96)(8) = 20 ± 15.68 = 4.32 < µ < 35.68 4 Where is the standard error of the mean (SEM) calculation? σ= σ= 8 σ x x x
mean = 121 standard deviation= 15 n = 25 σ standard error of the mean = Find a 95% Confidence Interval for this distribution n √ 100 110 120 130 140 raw score = mean + (z score)(standard error) 15 = = 3 √ 25 raw score = mean ± (z score)(sem) Please notice: We know the standard deviation and can calculate the standard error of the mean from it X = 121 ± (1.96)(3) = 121 ± 5.88 (115.12, 126.88) x = x ± (z)(σx) confidence interval
= .05 = .10 = .01 Confidence Interval for a mean when we know standard deviation When we don’t know the standard deviation of population we have to estimate it and are required to use t-scores (not z-scores) x = x ± (z)(σx) 99% CI 95% CI 90% CI 1.645 1.960 2.576
Confidence intervals Level of Alpha = .10 = .05 = .01 Construct a 95 percent confidence interval around the mean Tell me the scores that border exactly the middle 95% of the curve - use z score of 1.96 2.58 z scores for different levels of confidence 1.96 1.64 90% How do we know which z score to use?
Confidence Interval of 95%Has and alpha of 5%α = .05 Confidence Interval of 99% Has and alpha of 1% α = .01 99% Area outside confidence interval is alpha 95% Area in the tails is called alpha 90% Confidence Interval of 90% Has and alpha of 10% α = . 10 Area associated with most extreme scores is called alpha
Measurements that occur within the middle part of the curve are ordinary (typical) and probably belong there Area outside confidence interval is alpha Area outside confidence interval is alpha Moving from descriptive stats into inferential stats…. 99% 95% Measurements that occur outside this middle ranges are suspicious, may be an error or belong elsewhere 90%
How do we know if something is going on?How rare/weird is rare/weird enough? Every day examples about when is weird, weird enough to think something is going on? • Handing in blue versus white test forms • Psychic friend – guesses 7 out of 10 coin tosses right • Cancer clusters – how many cases before investigation • Weight gain treatment – one group gained an average of 1 pound more than other group…what if 10?
Why do we care about the z scores that define the middle 95% of the curve?Inferential Statistics Hypothesis testing with z scores allows us to make inferences about whether the sample mean is consistent with the known population mean. • Is the mean of my observed sample consistent with the • known population mean or did it come from some other • distribution?
Why do we care about the z scores that define the middle 95% of the curve? If the z score falls outside the middle 95% of the curve, it must be from some other distribution Main assumption: We assume that weird, or unusual or rare things don’t happen If a score falls out into the 5% range we conclude that it “must be” actually a common score but from some other distribution That’s why we care about the z scores that define the middle 95% of the curve
. Main assumption: We assume that weird, or unusual or rare things don’t happen I’m not an outlier I just haven’t found my distribution yet If a score falls out into the tails (low probability) we conclude that it “must be” a common score from some other distribution
. .. Reject the null hypothesis Relative to this distribution I am unusual maybe even an outlier 95% X Relative to this distribution I am utterly typical 95% X Support for alternative hypothesis
Rejecting the null hypothesis . notnull null big z score x x • If the observed z falls beyond the critical z in the distribution (curve): • then it is so rare, we conclude it must be from some other distribution • then we reject the null hypothesis • then we have support for our alternative hypothesis Alternative Hypothesis • If the observed z falls within the critical z in the distribution (curve): • then we know it is a common score and is likely to be part of this distribution, • we conclude it must be from this distribution • then we do not reject the null hypothesis • then we do not have support for our alternative . null x x small z score
Rejecting the null hypothesis • If the observed z falls beyond the critical z in the distribution (curve): • then it is so rare, we conclude it must be from some other distribution • then we reject the null hypothesis • then we have support for our alternative hypothesis • If the observed z falls within the critical z in the distribution (curve): • then we know it is a common score and is likely to be part of this distribution, • we conclude it must be from this distribution • then we do not reject the null hypothesis • then we do not have support for our alternative hypothesis
Rejecting the null hypothesis • The result is “statistically significant” if: • the observed statistic is larger than the critical statistic (which can be a ‘z” or “t” or “r” or “F” or x2) • observed stat > critical stat If we want to reject the null, we want our t (or z or r or F or x2) to be big!! • the p value is less than 0.05 (which is our alpha) • p < 0.05 If we want to reject the null, we want our “p” to be small!! • we reject the null hypothesis • then we have support for our alternative hypothesis
Thank you! See you next time!!