Advanced Grism Spectroscopy with FLITECAM: Exploring Infrared Wavelengths
250 likes | 371 Vues
This detailed overview presents the capabilities and applications of the FLITECAM instrument, a Near-Infrared camera designed for spectroscopy in the 1-5.5 micron range. With a 1024x1024 InSb Aladdin III detector cooled to ~80K and controlled at 30K, FLITECAM provides low-background, high-resolution spectroscopic observations. Calibration techniques, including water vapor monitoring and slit mechanism designs, enhance its efficacy. This innovative tool enables the study of critical astrophysical phenomena, like PAH features and water ice, at wavelengths not covered by previous missions such as Spitzer.

Advanced Grism Spectroscopy with FLITECAM: Exploring Infrared Wavelengths
E N D
Presentation Transcript
Grism Spectroscopy with FLITECAM Erin C. Smith (UCLA) Ian S. McLean (UCLA)
FLITECAM 1- 5.5 micron NIR camera 1024x1024 InSb Aladdin III detector Optics cooled to ~ 80K with LN2 Detector controlled at 30K
Re-imaging optics Detector Dual Filter Wheel 8 arcminute circular FOV .43 arcsec/pixel (SOFIA) .48 arcsec/pixel (Lick) Entrance aperture Collimator Slit mechanism
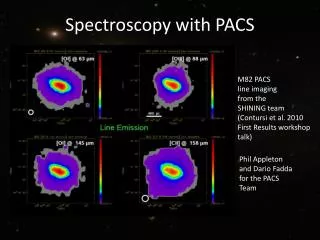
Why spectroscopy? • Water Vapor monitor calibration • Resolve 2.5 micron water line (need R~1000) • Allows low background, low water vapor spectroscopy in the thermal (3-5.5 micron IR) • No spectral coverage by Spitzer at these wavelengths
Science PAH features at 3.3 m Water ices 2.5-4.6 m Pa-a (1.87 m ) Br- (4.05 m )
d Xmm=dpupil/cos A A grism normal d dpupil i Grism Spectroscopy T m c= (n –1) sin A R = 206265 (n – 1) dpupil tan A / Dtel sarc , (max/min wavelength) = c +/- [(n – 1) dpix cos A / Fcam m T] *Npix/2,
KRS-5 • N~2.4 • Thalium bromo-iodide • Manufactured by Zeiss-Jena • Can make grisms with T=651/n, up to 40 degrees
Lab testing • Neon Argon lamps used to calibrate wavelength solutions • Slit width found to be slightly larger than designed, narrow slit is 1.3”, wide slit is 2.35” wide • R ~1700/900
FLITECAM also mounts to the Shane 3 meter telescope at Lick Observatory Imaging mode commissioned October 2002 Spectroscopy mode was commissioned in June 2004
Difference RAW 69 Leo C + LM C + Kwide A0V star, for telluric standards High backgrounds at Lick require differences in thermal IR 2.756 1.872 2.346 3.467
Gl406- (M5.5) Raw H band spectrum A-B spectrum High res position A High-res position B
Imaging & spectroscopy • Switching between spectroscopy and imaging takes less than 20 seconds • Using narrow band filters, we can make maps of spectral features, then use spectroscopy to investigate