Download

1 / 14
140 likes | 282 Vues
Introducing the Bureau of Transportation Statistics’ Geographic Information Services. Call in Number: 877-336-1839 Participant Passcode: 2683607 Presented by: Derald Dudley Geographer Bureau of Transportation Statistics. Office of Geographic Information Services (OGIS).

E N D
Introducing the Bureau of Transportation Statistics’ Geographic Information Services Call in Number: 877-336-1839 Participant Passcode: 2683607 Presented by: Derald Dudley Geographer Bureau of Transportation Statistics
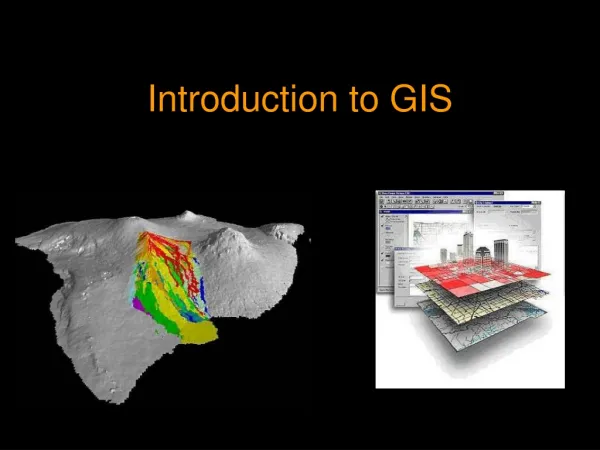
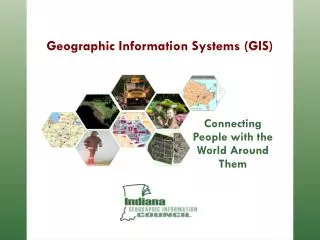
Office of Geographic Information Services (OGIS) OGIS is a national resource for transportation spatial data and analysis that utilizes Geographic Information Systems (GIS). GIS enables planners and others to visualize large quantities of transportation data, rendering it more meaningful. GIS helps highlight the transportation system's reach, coverage, modal relationships, key corridors, and relationship to our nation's economic activity and environment.
OGIS Functions • Transportation data collection • Publish • Transportation data • Data services • Application development • Spatial analysis • Cartographic production
Data Publication and Applications Development Goals • Make Transportation Data Accessible • Publish and distribute the National Transportation Atlas Database • Publish data services • Representational State Transfer (REST) Services • WCF Data Services • Provide Transportation Knowledge and Context • Publish Web Mapping Applications which… • Provide spatial and statistical analysis of each mode of transportation • Aggregate and analyze data at the national, state, county, and congressional district levels • Provide comparisons at each level (e.g. rankings, categorization and percentages) • Use Visualization tools (e.g. maps and charts)
Making Transportation Data Accessible: NTAD • Majority of data, that supplies BTS’ web mapping applications, comes from the National Transportation Atlas Database (NTAD) • NTAD was mandated by Congress the same time they created BTS through Title 49 USC 111 – 7 (f)(1) • What is NTAD? • A set of nationwide geographic databases of transportation facilities, transportation networks, and associated infrastructure. • The data support research, analysis, and decision-making across all modes of transportation. • Developed in cooperation with other agencies both inside and outside the USDOT. • Updated annually • New data are identified and included http://www.rita.dot.gov/bts/sites/rita.dot.gov.bts/files/publications/national_transportation_atlas_database/2013/index.html Metadata: http://catalog.data.gov/organization/dot-gov
Making Transportation Data Accessible: NTAD • 33 datasets offered in 2013
Intermodal Passenger Connectivity Webinar Intermodal Freight Facilities and their Connections Aug 28, 2013 - 1:30pm to 2:30pm EDT https://connectdot.connectsolutions.com/facilities/ Conference Number(s): 1-877-336-1839 Participant Code: 2683607 Conference Room E36-124 1200 New Jersey Avenue, S.E. Washington, DC 20590
Making Transportation Data Accessible: Data Services • Data services provide a single source for data access via the internet • This is an advantage because • A single data source can be accessed from numerous locations • Multiple interfaces can be developed against a single data source • OGIS uses two service types • REST Services for publishing spatial data • WCF Data Services for publishing non spatial data
Web Applications • Two Applications have been Published • State Facts and Figures • Structurally Deficient Bridges • Three are being developed • Ports • Intermodal Passenger Connectivity • National Transportation Atlas • Users of OGIS web applications will need to download Silverlight
The State Facts and Figures Application • The application arises from the State Transportation Statistics report published by BTS • State Transportation Statistics (STS) are a series of reports highlighting major federal databases and other national sources related to each state's • Infrastructure • Safety • Freight movement • Passenger travel • Vehicles • Economy and finance • Energy and the environment • Along with tables generated for each state, the reports describe databases and offers information on access, formats, and contact points. • The latest data release occurs on Friday, August 30th, 2013 http://www.rita.dot.gov/bts/sites/rita.dot.gov.bts/files/publications/state_transportation_statistics/index.html
The Structurally Deficient Bridges Application • The application is based on the National Bridge Inventory (NBI) maintained by the Federal Highway Administration • The NBI is a database, compiled by the Federal Highway Administration, with information on all bridges and tunnels in the United States that have roads passing above or below. • Bridge information includes • Bridge Design • Dimensions of the usable portion. • Data is often used to analyze bridges and their conditions. • The application is restricted to mapping Structurally Deficient Bridges on the National Highway system http://www.fhwa.dot.gov/bridge/nbi.cfm
Deficient Bridges on the National Highway System • Upon opening the application presents national and state level reports • The national report includes • Total, Average, Maximum and Minimum bridge counts for • Bridges in the NBI • Bridges on the NHS • Structurally Deficient Bridges on the NHS • A report for each state • Bridges in the NBI • Bridges on the NHS • Structurally Deficient Bridges on the NHS • Percentage of Structurally Deficient Bridges http://gis.rita.dot.gov/DBridges/
Applications Under Development • Ports • Reports about imports and exports • Ranking of commodities imported and exported • Intermodal Passenger Connectivity • How well are passenger carrying modes connected • http://50.16.205.167/IntermodalPax_081313/Silverlight.aspx • National Transportation Atlas • A single application to report statistics about multiple transportation datasets • Airports • Bridges • Major ports • Fatal highway crashes • Passenger facilities