Download
1 / 13
130 likes | 386 Vues
Estimating Hydropower Potential Using EDNA Stage 1B Data: Arkansas-White-Red River Basin Pilot Study. Alan Rea. Overview. Project Goal: Estimate Hydropower potential on each stream reach and total Hydropower potential in U.S. (Cooperator: INEEL/U.S. Department of Energy)

E N D
Estimating Hydropower Potential Using EDNA Stage 1B Data: Arkansas-White-Red River Basin Pilot Study Alan Rea
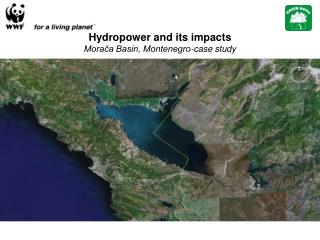
Overview • Project Goal: Estimate Hydropower potential on each stream reach and total Hydropower potential in U.S. (Cooperator: INEEL/U.S. Department of Energy) • Data Needed: Drainage Area, Avg. Ann. Precip, Temp, Mean Ann. Flow, Elevation (head) change on each reach • Pilot Study Area: Arkansas-White-Red River Basin (Hydrologic Region 11)
Basic Approach • Compute catchment characteristics • Extract node elevations for synthetic streams • Append catchments, synthetic streams for Ark, White, Red Rivers • For each catchment, trace upstream network, select polygons, aggregate basin characteristics • Compute flow, power potential estimates on synthetic streams
Stream Reach Flow Estimation • EDNA catchments were overlaid with climate data from the Oregon State University PRISM Dataset • Mean annual precipitation • Mean annual temperature • Stream flow regression equation from: Vogel, Wilson, and Daly (1999), “Regional Regression Models of Annual Streamflow for the United States”: Journal of Irrigation and Drainage Engineering, May/June 1999, p. 148-157
Stream Reach Flow Estimation (Cont.) Stream Flow Regression Equation Arkansas White Red Region Q11 = e-18.627A0.96494P3.8152T-1.9665 where • Q is the mean flow for a site in Region 11 (A-W-R), in cubic meters per second • A is drainage area, in square kilometers • P is mean annual precipitation, in mm/yr • T is mean annual temperature, in degrees Fahrenheit times 10
Basic Approach (one gory detail) • Node elevations: Two Approaches • Node elev from Filled DEM • Min elev (orig DEM) within 3-cell buffer of nodes (Grid FOCALMIN function)
Results • Processed, computed estimates for 78,993 catchments • Flow and drainage areas compared for 283 stream gages. D.A.’s mostly differ by < 5% • Hydropower estimate: 5.5 million KW • Fill vs. Focalmin-based power estimates differ by < 1 % for Arkansas, White, < 3% for Red
Caveats: • Flow equation valid range: 25 – 44,000 sq. mi. • EDNA Stage 1B errors • Synthetic stream network errors • Mismatches between EDNA tiles • Noncontributing areas connected • Flow reductions in High Plains
Conclusions • We can do some very useful analyses with EDNA Stage 1B data • You have to be careful with the results • Many errors cancel out or self-correct as you go downstream