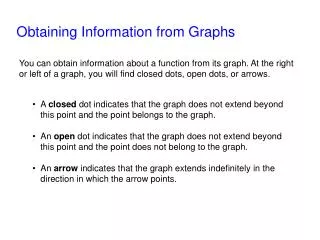
Obtaining Information from Graphs
Obtaining Information from Graphs. You can obtain information about a function from its graph. At the right or left of a graph, you will find closed dots, open dots, or arrows. A closed dot indicates that the graph does not extend beyond this point and the point belongs to the graph.

Obtaining Information from Graphs
E N D
Presentation Transcript
Obtaining Information from Graphs You can obtain information about a function from its graph. At the right or left of a graph, you will find closed dots, open dots, or arrows. • A closed dot indicates that the graph does not extend beyond this point and the point belongs to the graph. • An open dot indicates that the graph does not extend beyond this point and the point does not belong to the graph. • An arrow indicates that the graph extends indefinitely in the direction in which the arrow points.
5 4 3 2 1 -5 -4 -3 -2 -1 1 2 3 4 5 -1 -2 -3 -4 -5 more more Example: Obtaining Information from a Function’s Graph • Use the graph of the function f to answer the following questions. • What are the function values f (-1) and f (1)? • What is the domain of f (x)? • What is the range of f (x)? Solution a. Because (-1, 2) is a point on the graph of f, the y-coordinate, 2, is the value of the function at the x-coordinate, -1. Thus, f (-l) = 2. Similarly, because (1, 4) is also a point on the graph of f, this indicates that f (1) = 4.
5 4 3 2 1 -5 -4 -3 -2 -1 1 2 3 4 5 -1 -2 -3 -4 -5 more more Example: Obtaining Information from a Function’s Graph Solution b. The open dot on the left shows that x = -3 is not in the domain of f. By contrast, the closed dot on the right shows that x = 6 is. We determine the domain of f by noticing that the points on the graph of f have x-coordinates between -3, excluding -3, and 6, including 6. Thus, the domain of f is { x | -3 < x< 6} or the interval (-3, 6].
5 4 3 2 1 -5 -4 -3 -2 -1 1 2 3 4 5 -1 -2 -3 -4 -5 Example: Obtaining Information from a Function’s Graph Solution c. The points on the graph all have y-coordinates between -4, not including -4, and 4, including 4. The graph does not extend below y = -4 or above y = 4. Thus, the range of f is{ y | -4 < y< 4} or the interval (-4, 4].
The Vertical Line Test for Functions If any vertical line intersects a graph in more than one point, the graph does not define y as a function of x.
Use the vertical line test to identify graphs in which y is a function of x. a. b. c. d. y y y y x x x x a. b. c. d. y y y y x x x x y is not a function since 2 values of y correspond to an x-value. y is a function of x. y is a function of x. y is not a function since 2 values of y correspond to an x-value. Example: Using the Vertical Line Test Solution y is a function of x for the graphs in (b) and (c).
(x2, f (x2)) (x2, f (x2)) (x1, f (x1)) (x1, f (x1)) (x1, f (x1)) (x2, f (x2)) Increasing f (x1) < f (x2) Decreasing f (x1) > f (x2) Constant f (x1) = f (x2) Increasing, Decreasing, and Constant Functions A function is increasing on an interval if for any x1, and x2 in the interval, where x1 < x2, then f (x1) < f (x2). A function is decreasing on an interval if for any x1, and x2 in the interval, where x1 < x2, then f (x1) > f (x2). A function is constant on an interval if for any x1, and x2 in the interval, where x1 < x2, then f (x1) = f (x2).
a. b. 5 5 4 4 3 3 2 1 1 -5 -4 -3 -2 -1 1 2 3 4 5 -5 -4 -3 -2 -1 1 2 3 4 5 -1 -1 -2 -2 -3 -3 -4 -4 -5 -5 more more Example: Intervals on Which a Function Increases, Decreases, or Is Constant Describe the increasing, decreasing, or constant behavior of each function whose graph is shown. Solution a. Take note as to when the function changes direction. The function is decreasing on the interval (-oo, 0), increasing on the interval (0, 2), and decreasing on the interval (2, oo).
a. b. 5 5 4 4 3 3 2 1 1 -5 -4 -3 -2 -1 1 2 3 4 5 -5 -4 -3 -2 -1 1 2 3 4 5 -1 -1 -2 -2 -3 -3 -4 -4 -5 -5 Example: Intervals on Which a Function Increases, Decreases, or Is Constant Describe the increasing, decreasing, or constant behavior of each function whose graph is shown. Solution The graph indicates that the function is defined in two pieces. The part of the graph to the left of the y-axis shows that the function is constant with an open endpoint on the right. So the function is constant on the interval (-oo, 0). The part to the right of the y-axis shows that the function is increasing on the interval with a closed dot on the left. So the function is increasing on the interval [0, oo).
Definition of Even and Odd Functions The function f is an even function if f (-x) = f (x) for all x in the domain of f. The right side of the equation of an even function does not change if x is replaced with -x. The function f is an odd function if f (-x) = -f (x) for all x in the domain of f. Every term in the right side of the equation of an odd function changes sign if x is replaced by -x.
Identify the following function as even, odd, or neither: f(x) = 3x2 - 2. Solution: We use the given function’s equation to find f(-x). f(-x) = 3(-x) 2-2 = 3x2 - 2. The right side of the equation of the given function did not change when we replaced x with -x. Because f(-x) = f(x), f is an even function. Example
Identify the following function as even, odd, or neither: g(x) = x2 + x - 2. Solution: We use the given function’s equation to find g(-x). g(-x) = (-x) 2 + (-x) - 2 = x2 - x - 2. The right side of the equation of the given function changed when we replaced x with -x. Because g(-x) ≠ g(x), f is not an even function. Next we check to see if the function is odd where -g(x) = g(-x). -g(x) = -(x2 + x - 2) = -x2 - x + 2 ≠ x2 - x - 2 = g(-x) So the function is not an odd fiunction. Therefore the function is neither. Example
Even Functions and y-Axes Symmetry The graph of an even function in which f (-x) = f (x) is symmetric with respect to the y-axis. Odd Functions and Origin Symmetry The graph of an odd function in which f (-x) = - f (x) is symmetric with respect to the origin.
Definitions of Relative Maximum and Relative Minimum • A function value f(a) is a relative maximum of f if there exists an open interval about a such that f(a) > f(x) for all x in the open interval. • A function value f(b) is a relative minimum of f if there exists an open interval about b such that f(b) < f(x) for all x in the open interval.
The Average Rate of Change of a Function • Let (x1, f(x1)) and (x2, f(x2)) be distinct points on the graph of a function f. • The average rate of change of f from x1 to x2 is