Download
1 / 47
470 likes | 488 Vues
Explore motion diagrams, particle models, coordinate systems, vectors, scalars, displacement, and distance in physics with examples and explanations. Essential physics concepts visually explained.

E N D
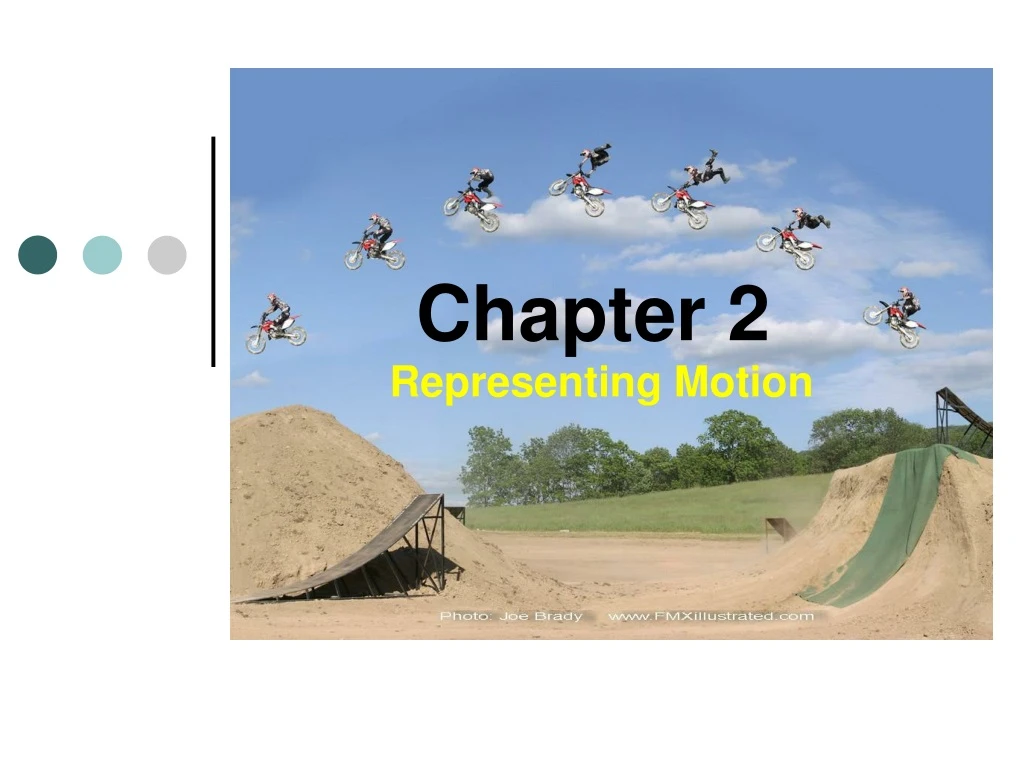
Chapter 2 Representing Motion
Section 2.1 Picturing Motion • Essential Questions: • How do motion diagrams represent motion? • How can you use a particle model to represent a moving object?
All Kinds of Motion • Motion Diagram – a series of images showing the positions of a moving object at equal time intervals. When is the runner’s speed changing? When is the runner’s speed not changing?
Particle Models • In a particle model you replace the object or objects in interest with single points. Describe the skateboarder in this particle model.
Section 2.1 Picturing Motion • Did We Answer Our Essential Questions? • How do motion diagrams represent motion? • How can you use a particle model to represent a moving object?
Section 2.2 Where and When? • Essential Questions: • What is a coordinate system? • How does the chosen coordinate system affect the sign of objects’ positions? • How are time intervals measured? • What is displacement? • How are motion diagrams helpful in answering questions about an object’s position or displacement?
Section 2.2 Where and When? • A coordinate system gives the location of the zero point of the variable you are studying and the direction in which the values of the variable increase. This is also called the frame of reference.
The origin is the point at which all variables in a coordinate system have the value zero. This is also called the reference point.
Position • Position (d) - the separation between an object and a reference point. Has both magnitude and direction, hence a vector. • Position can also be labeled x, y, h, etc.
Negative Position • Going in reverse from the origin will produce a negative position. • Ie. Going backwards from the starting line. • Moving West, South, down will also produce a negative position.
Ex #3. While John is traveling along an interstate highway, he notices a 160 mile marker as he passes through town. Later John passes another mile marker, 115. What is John’s current position? x = +115 mi
Scalars • A quantity that is just a number without direction, such as distance, length, volume, time, or mass, is called a scalar. • Scalar values will not be negative.
Distance is scalar • Distance - Needs no reference frame. Measure the distance between two objects by measuring the entire length of an object’s path.
Ex #4. While John is traveling along an interstate highway, he notices a 160 mile marker as he passes through town. Later John passes another mile marker, 115. What is John’s distance? x = 45 miles
Time intervals are scalar • The difference between two times is called a time interval. A common symbol for time interval is Δt. • Δt = tf - ti • Since we cannot go back in time, Δt will never be negative, hence a scalar quantity.
Vectors • A quantity that has both magnitude and direction is called a vector. • A quantity with size or amount is called magnitude. • A quantity that is a vector will be represented by a boldface letter.
Position and displacement are vectors • Since positions can be described as negative or positive in order to indicate direction, it is considered a vector quantity. • A change in position is called displacement, which is also a vector quantity. • Displacement vectors are usually green. • Δd = df -di • Δx = xf –xi • Δy = yf -yi
Distance vs. Displacement • Displacement ( d) - A change in position (d2 - d1). Displacement is a vector quantity. It can be a positive or negative value. • Distance - Not a vector, but scalar.
Ex #5. A student walks around the block of dimensions 20.0 m by 25.0 m. a. Find the displacement. b. Find the distance. • Zero displacement. The beginning and ending points are the same, so no displacement. • 20.0 m + 25.0 m + 20.0 m + 25.0 m = 90.0 m is the distance traveled
Vector addition and subtraction • A vector that represents the sum of two other vectors is called a resultant.
Ex #6. Add the following using vectors: 5 km east and 2 km east. 5 km 2 km 7 km east
Ex #7. Subtract the following vectors: 5 km east minus 2 km east. 5 km 2 km 3 km east
Ex #8. Add the following vectors: 5 km east and 2 km north. 5.4 km 2 km 5 km
Section 2.2 Where and When? • Did We Answer Our Essential Questions? • What is a coordinate system? • How does the chosen coordinate system affect the sign of objects’ positions? • How are time intervals measured? • What is displacement? • How are motion diagrams helpful in answering questions about an object’s position or displacement?
Section 2-3 Position-Time Graphs • Essential Questions: • What information do position-time graphs provide? • How can you use a position-time graph to interpret an object’s position or displacement? • What are the purposes of equivalent representations of an object’s motion?
Section 2-3 Position-Time Graphs • Position-time graph – a graph in which the time data is plotted on the x-axis (horizontal) and the position is plotted on the y-axis (vertical).
Ex #8. Find the distance and displacement using the following position-time graph.
Instantaneous Position • The position of an object at a particular instant is called the instantaneous position.
Equivalent Representations • There are several different ways to describe motion; words, pictures, motion diagrams, data tables, or position-time graphs.
Section 2-3 Position-Time Graphs • Did We Answer Our Essential Questions? • What information do position-time graphs provide? • How can you use a position-time graph to interpret an object’s position or displacement? • What are the purposes of equivalent representations of an object’s motion?
Section 2-4 How Fast? • Essential Question: • What is velocity? • What is the difference between speed and velocity? • How can you determine an object’s average velocity from a position-time graph? • How can you represent motion with pictorial, physical, and mathematical models?
Velocity and Speed • Average Velocity – the ratio of an object’s change in position to the time interval during which the change occurred. • A vector quantity. • v = x/t (slope on a position-time graph) • v = (x2 - x1)/(t2 - t1) • Common unit is meter per second (m/s).
Average Speed • Average speed in NOT a vector quantity. It is the absolute value of the slope of an object’s position-time graph.
Ex #9: Find the velocity of this object between a) 0 and 10 seconds, b) 15 and 40 seconds?
Instantaneous Velocity • The speed and direction of an object at a particular instant is called the instantaneous velocity. • v = x/t • Average velocity is different from instantaneous velocity.
Finding Instantaneous Velocity From a Position-Time Graph Tangent to the curve is used to find instantaneous velocity on a non-linear graph.
Equation of Motion • Derive Time! v = (x2 – x1)/t v t= (x2 – x1) v t + x1 = x2 x2 = vt + x1 • An object’s position is equal to the average velocity multiplied by the time plus the initial position.
Ex #10. A high-speed train travels from Paris to Lyons at an average velocity of +227 km/h. The trip takes 2.00 h. How far is Lyons from Paris? x = vt + xi x= (+227 km/h)(2.00 h) + 0.0 km x = +454 km
Velocity and Vectors • The length of each velocity vector is proportional to the magnitude of the velocity that it represents. • Velocity vectors are normally red.
Ex #11. If Keith is strolling east at an average velocity of 3.0 m/s, and Sue is power-walking west at an average velocity of 6.0 m/s, how long will it take them to meet if the road between them is 250 m? d1 + d2 = 250 m v1t + v2t = 250 m (3.0 m/s)(t) + (6.0 m/s)(t) = 250 m (9.0 m/s)(t) = 250 m t = 27.7777777 s t = 28 seconds
Section 2-4 How Fast? • Did We Answer Our Essential Question? • What is velocity? • What is the difference between speed and velocity? • How can you determine an object’s average velocity from a position-time graph? • How can you represent motion with pictorial, physical, and mathematical models?


