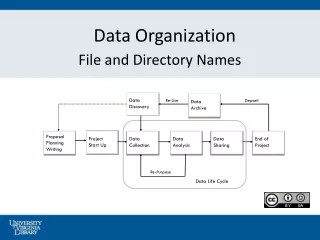
Data organization
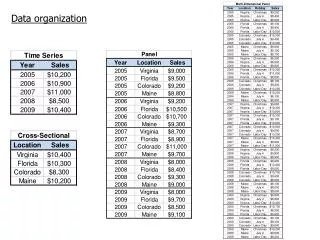
Data organization. Regression Models Time series Cross-sectional Panel Multi-dimensional panel. Errors in Uni -dimensional Data In standard time series or cross-sectional data sets, we must adjust for non-independent errors. Serial correlation Errors correlated across time

Data organization
E N D
Presentation Transcript
Regression Models • Time series • Cross-sectional • Panel • Multi-dimensional panel
Errors in Uni-dimensional Data In standard time series or cross-sectional data sets, we must adjust for non-independent errors. Serial correlation Errors correlated across time Spatial correlation Errors correlated across cross-sections Heteroskedasticity Error variance changes over time or cross-sections
Errors in Panel Data Heterogeneous serial correlation Errors correlated across time and differently for different cross-sections. Heterogeneous spatial correlation Errors correlated across cross-sections but differently for different time periods. Heterogeneous heteroskedasticity Error variance changes over time, but does so differently for different cross-sections. Serial-spatial correlation Past errors from one cross-section are correlated with future errors from a different cross-section.
Generalized Least Squares The error covariance matrix shows the covariances of error terms across different observations.
Two-Dimensional Panel Data: OLS (homogeneous serial correlation)
Two-Dimensional Panel Data: OLS (heterogeneous serial correlation)
Two-Dimensional Panel Data: OLS (serial-spatial correlation)
Fixed versus Random Effects Under the random effects assumption, and are treated as stochastic. Under the fixed effects assumption, they are treated as fixed in repeated samples.
Random vs. Fixed Effects Random Effects Assumption Pro: Estimators are more efficient Con: Estimators are inconsistent if any of the three errors are not IIN(0,σ2) across all dimensions. Fixed Effects Assumption Pro: Estimators are consistent regardless of and . Con: Estimators are less efficient. See Hausman test for endogeneity.
Random vs. Fixed Cross-Sectional Effects Test statistic = 22
Alternatives to Panel Techniques Separate Regressions Drawbacks Less efficient estimators due to lost information about cross-sectional error covariance. Remove the ability to restrict parameter values across cross-sections.
Alternatives to Panel Techniques Pooled Regression Drawbacks Less efficient estimators due to lost information about cross-sectional error covariance. Restricts parameter values to be equal across cross-sections.
Alternatives to Panel Techniques Pooled Regression with Cross-Sectional Dummies Drawbacks This is the fixed effects panel technique. If the cross-sectional dummies are IIN, then parameter estimates are less efficient than under the random effects panel technique.
Procedures to use with panel data Generalized least squares (GLS) Generalized method of moments (GMM) OLS with “automated” corrections for serial correlation, etc. is GLS.
Extra stuff Panel data reveals information that is unattainable with non-panel data.
These shocks all impact inflation in quarter 9 but occur in different quarters. These shocks all occur in quarter 6 but impact inflation in different quarters. Shock Occurrence vs. Shock Impact
Shock Occurrence vs. Shock Impact Cumulative shocks Cross-sectional shocks Discrete shocks