Download
1 / 36
370 likes | 443 Vues
Explore different types of random variables and probability distributions. Learn about Bernoulli, Binomial, Poisson, Geometric, and more distributions, with examples and calculations provided.

E N D
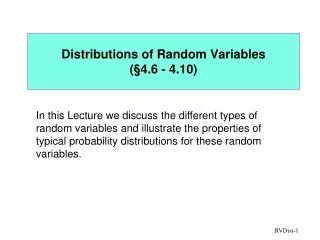
Distributions of Random Variables (§4.6 - 4.10) In this Lecture we discuss the different types of random variables and illustrate the properties of typical probability distributions for these random variables.
What is a Random Variable? A variable is any characteristic, observed or measured. A variable can be either random or constant in the population of interest. Note this differs from common English usage where the word variable implies something that varies from individual to individual. For a defined population, everyrandomvariable has an associated distribution that defines the probability of occurrence of each possible value of that variable (if there are a finitely countable number of unique values) or all possible sets of possible values (if the variable is defined on the real line).
Probability Distribution A probability distribution (function) is a list of the probabilities of the values (simple outcomes) of a random variable. Table: Number of heads in two tosses of a coin y P(y) outcome probability 0 1/4 1 2/4 2 1/4 For some experiments, the probability of a simple outcome can be easily calculated using a specific probability function. If y is a simple outcome and p(y) is its probability.
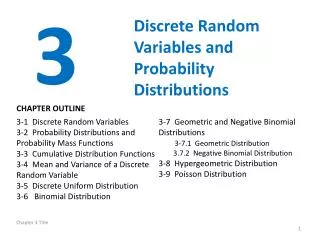
Discrete Distributions Yes-No responses. Sums of Bernoulli responses Number of trials to kth event Points in given space Number of trials until first success Multiple possible outcomes for each trial Relative frequency distributions for “counting” experiments. • Bernoulli Distribution • Binomial Distribution • Negative Binomial • Poisson Distribution • Geometric Distribution • Multinomial Distribution
Binomial Distribution • The experiment consists of n identical trials (simple experiments). • Each trial results in one of two outcomes (success or failure) • The probability of success on a single trial is equal to and remains the same from trial to trial. • The trials are independent, that is, the outcome of one trial does not influence the outcome of any other trial. • The random variable y is the number of successes observed during n trials. n!=1x2x3x…x n Mean Standard deviation
Binomial probability density function forms As the n goes up, the distribution looks more symmetric and bell shaped.
Binomial Distribution Example 20 18 16 14 12 10 8 6 4 2 0 0 1 2 3 4 5 Basic Experiment: 5 fair coins are tossed. Event of interest: total number of heads. Each coin is a trial with probability of a head coming up (a success) equal to 0.5. So the number of heads in the five coins is a binomial random variable with n=5 and p=.5. The Experiment is repeated 50 times. # of heads ObservedTheoretical 0 1 1.56 1 11 7.81 2 11 15.63 3 19 15.63 4 6 7.81 5 2 1.56
Two Dice Experiment 33/50 =.66 37/50 = .74 34/50 = .68 Two dice are thrown and the number of “pips” showing are counted (random variable X). The simple experiment is repeated 50 times. Outcome Frequency Relative Freq 2 2 0.04 3 4 0.08 4 4 0.08 5 3 0.06 6 4 0.08 7 7 0.14 8 9 0.18 9 3 0.06 10 5 0.10 11 7 0.14 12 2 0.04 total 50 1.00 Approximate probabilities for the random variable X: P(X8)= P(X6)= P(4X10)=
Vegetation Sampling Data 20 18 16 14 12 10 8 6 4 2 0 0 1 2 3 4 5 6 7 A typical method for determining the density of vegetation is to use “quadrats”, rectangular or circular frames in which the number of plant stems are counted. Suppose 50 “throws” of the frame are used and the distribution of counts reported. If stems are randomly dispersed, the counts could be modeled as a Poisson distribution. Count Frequency (stems) (quadrats) 0 12 1 15 2 9 3 6 4 4 5 3 6 0 7 1 total 50 # of stems per quadrat
Poisson Distribution A random variable is said to have a Poisson Distribution with rate parameter , if its probability function is given by: e=2.718… Mean and variance for a Poisson Ex: A certain type of tree has seedlings randomly dispersed in a large area, with a mean density of approx 5 per sq meter. If a 10 sq meter area is randomly sampled, what is the probability that no such seedlings are found? P(0) = 500(e-50)/0! = approx 10-22 (Since this probability is so small, if no seedlings were actually found, we might question the validity of our model…)
Environmental Example Van Beneden (1994,Env. Health. Persp., 102, Suppl. 12, p.81-83) describes an experiment where DNA is taken from softshell and hardshell clams and transfected into murine cells in culture in order to study the ability of the murine host cells to indicate selected damage to the clam DNA. (Mouse cells are much easier to culture than clam cells. This process could facilitate laboratory study of in vivo aquatic toxicity in clams). The response is the number of focal lesions seen on the plates after a fixed period of incubation. The goal is to assess whether there are differences in response between DNA transfected from two clam species. The response could be modeled as if it followed a Poisson Distribution. Ref: Piegorsch and Bailer, Stat for Environmental Biol and Tox, p400
Discrete Distributions Take Home Messages • Primarily related to “counting” experiments. • Probability only defined for “integer” values. • Symmetric and non-symmetric distribution shapes. • Best description is a frequency table. Examples where discrete distributions are seen. Wildlife - animal sampling, birds in a 2 km x 2 km area. Botany - vegetation sampling, quadrats, flowers on stem. Entomology - bugs on a leaf Medicine - disease incidence, clinical trials Engineering - quality control, number of failures in fixed time
Continuous Distributions Foundations for much of statistical inference Environmental variables Time to failure, radioactivity Basis for statistical tests. Lifetime distributions • Normal Distribution • Log Normal Distribution • Gamma Distribution • Chi Square Distribution • F Distribution • t Distribution • Weibull Distribution • Extreme Value Distribution (Type I and II) Continuous random variables are defined for continuous numbers on the real line. Probabilities have to be computed for all possible sets of numbers.
Probability Density Function A theoretical shape - if we were able to sample the whole (infinite) population of possible values, this is what the associated histogram would look like. A mathematical abstraction A function which integrates to 1 over its range and from which event probabilities can be determined. f(x) Area under curve sums to one. Random variable range
Probability Density Function fX(x|b) The shape of the curve is determined by one or more distribution parameters. Chi Square density functions The pdf does not have to be symmetric, nor be defined for all real numbers.
Continuous Distribution Properties Probability can be computed by integrating the density function. Continuous random variables only have positive probability for events which define intervals on the real line. Any one point has zero probability of occurrence.
Cumulative Distribution Function P(X<x) x
Using the Cumulative Distribution P(xo < X < x1) = P(X< x1 ) - P(X < xo) = .8-.2 = .6 P(X< x1) P(X< xo) xo x1
Chi Square Cumulative Distribution Cumulative distribution does not have to be S shaped. In fact, only the normal and t-distributions have S shaped distributions.
Normal Distribution A symmetric distribution defined on the range - to + whose shape is defined by two parameters, the mean, denoted m, that centers the distribution, and the standard deviation, s, that determines the spread of the distribution. 68% of total area is between - and +. Area=.68 m+s m m-s
Standard Normal Distribution All normal random variables can be related back to the standard normal random variable. A Standard Normal random variable has mean 0 and standard deviation 1. m+3s m-s m+2s m-3s m m-2s m+s +1 +2 0 -2 +3 -3 -1
Density of (X-m)/s Density of X-m 1 Illustration Density of X s 0 m
To standardize we subtract the mean and divide by the standard deviation. Z=(X- )/ To create a random variable with specific mean and standard deviation, we start with a standard normal deviate, multiply it by the target standard deviation, and then add the target mean. Z+ = X Notation Suppose X has a normal distribution with mean and standard deviation , denoted X ~ N(, ). Then a new random variable defined as Z=(X- )/ , has the standard normal distribution, denoted Z ~ N(0,1). Why is this important? Because in this way, the probability of any event on a normal random variable with any given mean and standard deviation can be computed from tables of the standard normal distribution.
Relating Any Normal RV to a Standard Normal RV This probability can be found in a table of standard normal probabilities (Table 1 in Ott and Longnecker) This value is just a number, usually between 4 Other Useful Relationships Probability of complementary events. Symmetry of the normal distribution.
1.0 Normal Table Z 0.0 Ott & Longnecker, Table 1 page 676, gives areas left of z. This table from a previous edition gives areas right of z.
Using a Normal Table Find P(2 < X < 4) when X ~ N(5,2). The standarization equation for X is: Z = (X-)/ = (X-5)/2 when X=2, Z= -3/2 = -1.5 when X=4, Z= -1/2 = -0.5 P(2<X<4) = P(X<4) - P(X<2) P(X<2) = P( Z< -1.5 ) = P( Z > 1.5 ) (by symmetry) P(X<4) = P(Z < -0.5) = P(Z > 0.5) (by symmetry) P(2 < x < 4) = P(X<4)-P(X<2) = P(Z>0.5) - P( Z > 1.5) = 0.3085 - 0.0668 = 0.2417
Properties of the Normal Distribution .68 .95 m m+s m+2s m-2s m-s Standard Normal Form • Symmetric, bell-shaped density function. • 68% of area under the curve between m s. • 95% of area under the curve between m 2s. • 99.7% of area under the curve between m 3s. Empirical Rule
Probability Problems -1.83 1.83 By Symmetry Using symmetry and the fact that the area under the density curve is 1. Pr(Z > 1.83) = 0.0336 Pr(Z < 1.83)= 1-Pr( Z> 1.83) =1-0.0336 = 0.9664 Pr(Z < -1.83) = Pr( Z> 1.83) =0.0336
Probability Problems Pr( Z < 1.83 ) - Pr( Z < -0.6 ) Or Pr( Z > -0.6 ) - Pr( Z > 1.83 ) 1.83 -0.6 Cutting out the tails. Pr ( Z > -0.6) = Pr ( Z < +0.6 ) = 1 - Pr (Z > 0.6 ) = 1 - 0.2743 = 0.7257 Pr( -0.6 < Z < 1.83 )= Pr( Z > 1.83 ) = 0.0336 = 0.7257 - 0.0336 = 0.6921
Given the Probability - What is Z0 ? z0 must be negative, since Pr ( Z > 0.0 ) = 0.5 z0 = -1.12 Working backwards. Pr (Z > z0 ) = .1314 z0 = 1.12 Pr (Z < z0 ) = .1314 Pr ( Z < z0 ) = 0.1314 1. - Pr (Z > z0 ) = 0.1314 Pr ( Z > z0 ) = 1 - 0.1314 = 0.8686
Converting to Standard Normal Form Pr ( W > 80 ) = Pr( Z > (80 - 100) / 10 ) = Pr ( Z > -2.0 ) = 1.0 - Pr ( Z < -2.0 ) = 1.0 - Pr ( Z > 2.0 ) = 1.0 - 0.0228 = 0.9772 80 100 Suppose we have a random variable (say weight), denoted by W, that has a normal distribution with mean 100 and standard deviation 10. W ~ N( 100, 10) Pr ( W < 90 ) = Pr( Z < (90 - 100) / 10 ) = Pr ( Z < -1.0 ) = Pr ( Z > 1.0 ) = 0.1587
Decomposing Events W ~ N( 100, 10) 100 93 106 Pr ( 93 < W < 106 ) = Pr( W > 93 ) - Pr ( W > 106 ) = Pr [ Z > (93 - 100) / 10 ] - Pr [ Z > (106 - 100 ) / 10 ] = Pr [ Z > - 0.7 ] - Pr [ Z > + 0.6 ] = 1.0 - Pr [ Z > + 0.7 ] - Pr [ Z > + 0.6 ] = 1.0 - 0.2420 - .2743 = 0.4837
Finding Interval Endpoints W ~ N( 100, 10) What are the two endpoints for a symmetric area centered on the mean that contains probability of 0.8 ? Symmetry requirement |100 - wL| = | 100 - wU | 0.4 0.4 wL 100 wU Pr ( wL < W < wU ) = 0.8 Pr ( 100 < W < wU ) = Pr (wL < W < 100 ) = 0.4 Pr ( 100 < W < wU ) = Pr ( W > 100 ) - Pr ( W > wU ) = Pr ( Z > 0 ) - Pr ( Z > (wU – 100)/10 ) = .5 - Pr ( Z > (wU – 100)/10 ) = 0.4 Pr ( Z > (wU - 100)/10 ) = 0.1 => (wU - 100)/10 = z0.1 1.28 wU = 1.28 * 10 + 100 = 112.8 wL = -1.28 * 10 + 100 = 87.2
Probability Practice Using Table 1 in Ott &Longnecker Read probability in table using row (. 4) + column (.07) indicators. .6808 Pr( Z < .47) = 1-.6808=.3192 Pr(Z > .47) = 1-P(Z<.47)= Pr ( Z < -.47 ) = .3192 = 1.0 - .3192 = .6808 Pr ( Z > -.47 ) = 1.0 - Pr ( Z < -.47) Pr ( Z <1.56) - Pr ( Z < .21 ) Pr( .21 < Z < 1.56 ) = .9406 - 0.5832 = .3574 Pr ( Z < 1.23) - Pr ( Z < -.21 ) Pr( -.21 < Z < 1.23 ) = = .4739 .8907 - .4168
Finding Critical Values from the Table Find probability in the Table, then read off row and column values. 0.55 Pr ( Z > z.2912 ) = 0.2912 z.2912 = 1.645 Pr ( Z > z.05 ) = 0.05 z.05 = Pr ( Z > z.025 ) = 0.025 z.025 = 1.96 Pr ( Z > z.01 ) = 0.01 z.01 = 2.326