Public empowerment in flood mitigation
Explore a novel approach to flood mitigation through an interactive model representing extreme rainfall and river flooding in urban settings. Learn about Flood-excess Volume (FEV) and its significance, alongside cost-effective flood mitigation strategies. Enhance decision-making with visual representations and insightful analyses. Engage with policy makers, practitioners, and the public on effective flood management solutions.

Public empowerment in flood mitigation
E N D
Presentation Transcript
Onno Bokhove1, Mark Kelmanson1, Tom Kent1, Guillaume Piton2 & Jean-Marc Tacnet2 School of Mathematics, University of Leeds, UniversitéGrenoble Alpes, IRSTEA, France Flood & Coast, Telford, June 2019 Public empowerment in flood mitigation
Interactive model of extreme rainfall and river flooding in an urban environment conceptualises many important aspects of the science of flooding and extreme events in a way that is accessible to and directly engages the public Motivation: Wetropolis • It has inspired numerous discussions with flood practitioners & policy makers . . . https://github.com/obokhove/wetropolis20162020
Figure: Armley gauge data around the Boxing Day 2015 floods. Bottom left: water-level time series (raw data); top left: rating curve (stage-discharge relationship); top right: resulting discharge time series. Flood-excess volume (FEV): ... is the volume of flood water one wishes to mitigate (i.e., reduce to zero) by the cumulative effect of various flood-mitigation measures. FEV revisited: River Aire data analysis, UK
GOAL: to quantify and communicate the efficacy of various flood-mitigation measures in a straightforward, readily digestible and concise manner. IDEA: to calculate the FEV for a flood event of interest and express it as the capacity of a 2m-deep square `flood-excess lake' with side-lengths O(1km). OUTCOME: a graphical tool that both (i) contextualises the magnitude of the flood relative to the river and its valley/catchment and (ii) facilitates quick and direct assessment of the contribution and value of various mitigation measures. FEV: square lake representation For the River Aire case, the FEV is represented as a 2m-deep `flood-excess lake' of side-length 2.15km: Given the size of the lake as well as the geography of the river valley concerned, one can make an estimate of both the contribution and effectiveness of enhancement for not only flood storage but also other flood-mitigation measures.
Statement on BBC website: ``Beavers should be re-introduced to England to improve water supplies, prevent floods and tackle soil loss, a researcher says''. • ``Prevent floods'' by beaver dams: realistic, or not? • Mean FEV of 6 floods; Ve=3.35 Mm3=1294x1294x2m3. • Extra storage volume obtained of 1 beaver colony in Devon, Vb≈1100m3. • Given that 10s to 1000s of beaver colonies are required to mitigate 1% to 100%: flood prevention (very) unrealistic. FEV: square-lake cost-effectiveness analysis
Higher flood defence walls –HW: Flood mitigation: cost-effectiveness analysis & scenarios
Giving-room-to-the-river –GRR: Flood mitigation: cost-effectiveness analysis & scenarios
Flood-plain storage –FPS & dynamic weir control: Flood mitigation: cost-effectiveness analysis & scenarios
Natural flood management –NFM 1300 leaky dams (public engagement & co-benefits) plus 30 beaver colonies: Flood mitigation: cost-effectiveness analysis & scenarios
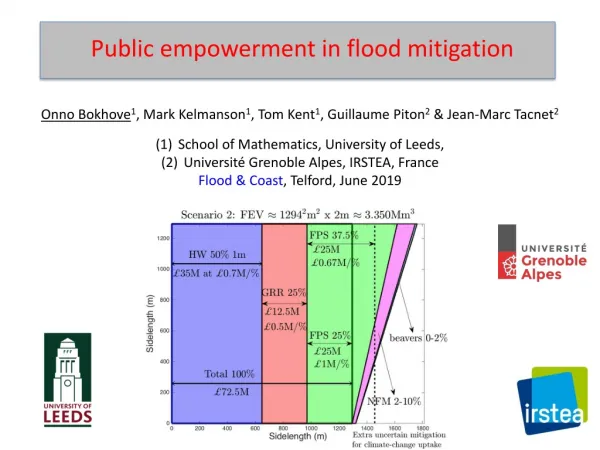
Cost-effectiveness analysis based on square-lake representation of FEV • for exploratory flood of River “BragueAireDonTamar” in 2015 with Ve= 3.35Mm3. • At city of “Feville” with two flood-mitigation scenarios summarised graphically —for policy makers in square-lakeformat! Flood mitigation: cost-effectiveness analysis & scenarios
The take-home message is that our FEV cost-effectiveness analysis offers: • a complementary way of classifying flood events but also • a protocol/sanity checkto assess, in a comprehensible and readily digestible way, flood-mitigation schemes, thus empowering decision-makers and the public. • Further comments: • Exploratory cost-effectiveness analysis has been used as sanity checkof actual mitigation planse.g., River Aire (Leeds' City Council) & Rivers Calder/Brague(EAs UK/France). • FEV enables one to quantify the contribution of NBS/NFM measures –this is rarely done in policy/literature –and highlights the issue of NFM scalability. • DIY: make your own hydrographusing a large ruler, oranges, a stopwatch & record-keeping! • DIY-toolof our work in progress –as Excel spreadsheet. Conclusions
References: [1] Bokhove, O., Kent, T., Zweers, W. (2016—2019): Wetropolisflood demonstrator. https://github.com/obokhove/wetropolis20162020 [2] O. Bokhove, M. Kelmanson, T. Kent, G. Piton, J.M.Tacnet (2018a/2019): A cost-effectiveness protocol for flood-mitigation: a sanity check on Leeds’ 2015 Boxing Day floods. Preliminary version: https://eartharxiv.org/stc7r/ [3] O. Bokhove, M. Kelmanson, T. Kent, G. Piton, J.-M. Tacnet (2018b/2019): Communicating (nature-based) flood-mitigation schemes using flood-excess volume.Accepted Rivers Research & Applications. Early version: https://eartharxiv.org/87z6w/ [4] O. Bokhove, M. Kelmanson, T. Kent (2018c): Using flood-excess volume in flood mitigation to show that upscaling beaver dams for protection against extreme floods proves unrealistic.https://eartharxiv.org/w9evx/ Funding: EPSRC DARE project & EU network NAIAD. Thanks very much for your attention ...
Cost-effectiveness analysis based on square-lake representation of FEV for our hypothetical flood of River ``BragueAireDonTamar'' in 2015 with Ve= 3.35 Mm3.Flood-mitigation measures (upstream of) city of ”Feville”; two scenarios S1 & S2: • HW –higher flood defencewallsS1: 100% wall height 2m or S2: 50% wall height 1m at £0.7M/% • GRR –giving-room-2-the-riverS1: 0% or S2: 25% at £0.5M/% • FPS – enhanced flood plain storage using dynamic weir with optimal controlS1: 0% or S2: (37.5±12.5)% at £1M/% • NFM –1300 leaky dams (including 50rs maintenance costs)S1: 0% or S2: (6±4)% at £1M/% (half costs) • 30 beaver colonies in parallel (at ~1100m3each)S1: 0% or S2: (1±1)% at £1M/% (half costs) • Mean extra climate-change adaptation (FPS, NFM, beavers)S1: 0% or S2: (19.5±17.5)%. • Recall climate-change uptake often taken as 20%! Flood mitigation: cost-effectiveness analysis & scenarios
Q: what fraction of FEV is reduced & at what cost, by suite of mitigation measures? Given a calculation (or estimate) of potential flood storage volume and associated cost of each mitigation measure, the `flood-excess lake' can be partitioned accordingly and overlaid with a cost per 1% of FEV mitigated. E.g., two scenarios from the Leeds Flood Alleviation Scheme Two (FASII): Leeds FASII+
Motivated by Boxing Day 2015 floods: flood-excess volume (FEV) is defined as volume of flood water one wishes to mitigate (i.e., reduce to zero) by cumulative effect of flood-mitigation measures. Right: River Don gauge data of June 2007 floods (3 fatalities). Bottom left: water-stage time series. Top left: rating curve. Top right: resulting discharge time series. Q: what fraction of the FEV is reduced, and at what cost, by particular flood-mitigation measures? FEV: River Don data analysis, UK
Graphical overview of fraction of the FEV captured by various measures in Don catchment for 7summer-rainfall scenarios. • Stacked vertically are respective probability distributions, relative to the associated FEV, fixed for all scenarios. • Blue shaded areas to left of thick, stepped, solid line denote fractions of FEV mitigated per scenario, to be read horizontally (e.g., 93.3% for (S3a)). • Mean FEV (43.25%) over all 7 scenarios and standard deviation (16.38%) indicated by thick and thin vertical dashed lines respectively. Rainfall scenarios: River Don
The `FEV-scenarios' framework is simple yet elegant: information covering a range of rainfall scenarios, mitigation measures, and geographical areas of a river catchment is encapsulated in a single graphic. Moreover, it is highly flexible and can incorporate any number of scenarios, rainfall distributions, and locations. Rainfall scenarios: River Don
Introducing `giving room to the river’ (GRR) bed widening: increasing river width to increase the discharge capacity for a similar water depth. • Figure: River Braguereconstructedflow data around the 2015 flash floods. Bottom left: water-stage time series. Top left: rating curve. Top right: resulting discharge time series and FEV. New –GRR— rating curve reduces FEV for same hT. • Q: what fraction of the FEV is reduced, and at what cost, by particular flood-mitigation measures? FEV assessment: River Brague data analysis, France
Exploratory flood-alleviation scheme comprising (i) storage in reservoirs (retention), (ii) flood walls, and (iii) GRR. • Ve=0.488Mm3 is represented by a 2m-deep square lake of side 494m • lighter colour = better value • over 1/2 of the €25.4M, scheme is related to the retention measures even though they manage only 25% of the problem • most cost-effective measure is GRR. FEV assessment: River Brague data analysis, France