What are Candlestick Chart?
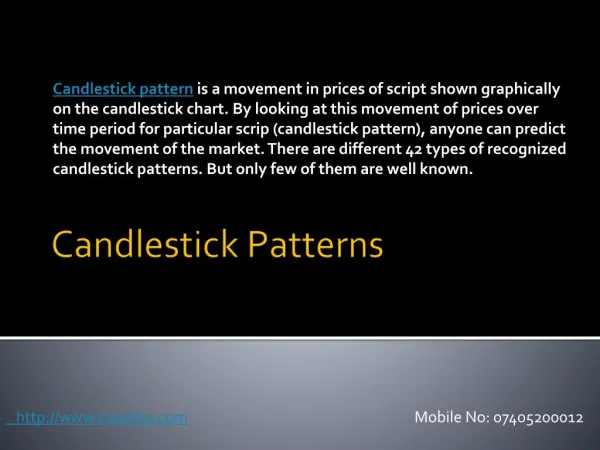
Candlestick chart patterns are a prominent component of technical analysis because they<br>allow traders to evaluate price information rapidly and from only a few price bars. You may<br>have seen colored, 2 sides pointed vertical rectangles bars on a stock price chart in your<br>early learning phases.

What are Candlestick Chart?
E N D
Presentation Transcript
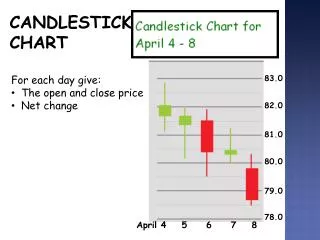
What are Candlestick Charts? Candlestick chart patterns are a prominent component of technical analysis because they allow traders to evaluate price information rapidly and from only a few price bars. You may have seen colored, 2 sides pointed vertical rectangles bars on a stock price chart in your early learning phases. Read More www.moneysukh.com STOCK EQUITY IPO MUTUAL FUND FUTURE & OPTION ETF SGB EVENT TRACKER Market Hunt Derivative reports Commodity reports Margin updates Monthly Magazine Blogs
A candlestick has three basic features: •Body, which represents the area between the opening price and closing price •Shadow or Wick, that maximum and minimum price level that the security touched •Colour, which reveals the direction of market movement Read More www.moneysukh.com STOCK EQUITY IPO MUTUAL FUND FUTURE & OPTION ETF SGB EVENT TRACKER Market Hunt Derivative reports Commodity reports Margin updates Monthly Magazine Blogs
Six bullish candlestick patterns Bullish candlestick patterns form after a market downtrend starts to lose steam, and signal a reversal in price movement. They act as an indicator for traders, who believe that the price has bottomed and are considering opening a long position to profit from any upward trajectory. Read More www.moneysukh.com STOCK EQUITY IPO MUTUAL FUND FUTURE & OPTION ETF SGB EVENT TRACKER Market Hunt Derivative reports Commodity reports Margin updates Monthly Magazine Blogs
Hammer Hammer candlestick pattern is a single candlestick pattern that appears at the end of a downward trend and indicates a bullish reversal. It is one of the most reliable and widely used candlestick patterns. The pattern is used to identify capitulation bottoms Read More www.moneysukh.com STOCK EQUITY IPO MUTUAL FUND FUTURE & OPTION ETF SGB EVENT TRACKER Market Hunt Derivative reports Commodity reports Margin updates Monthly Magazine Blogs
Inverse hammer Inverted hammer candlestick pattern is a single candlestick pattern. An inverse/ inverted hammer candlestick pattern often occurs at the end of a downtrend. It denotes a bullish reversal or a short-term downward trend reversal. Bullish engulfing For a bullish engulfing candlestick pattern to formulate there must be an ongoing downward trend. The engulfing pattern is the opposite of the harami pattern, except that the candle pattern cannot be the same color Read More www.moneysukh.com STOCK EQUITY IPO MUTUAL FUND FUTURE & OPTION ETF SGB EVENT TRACKER Market Hunt Derivative reports Commodity reports Margin updates Monthly Magazine Blogs
Piercing line Piercing candlestick pattern is formed near support levels and indicates a potential bullish reversal. This candle pattern is made up of two candlesticks, the first candlestick is a bearish and the second candlestick is a bullish. It’s a lot like the dark cloud cover pattern. Morning star Morning star candlestick pattern is opposite of the evening star candlestick pattern and it is a bullish bottom reversal pattern. It signals weakness in a downtrend, which could lead to a trend reversal. The morning star is made up of three candlesticks, with the middle candlestick forming a star. In the morning star pattern, the first candlestick must be red with a large real body Read More www.moneysukh.com STOCK EQUITY IPO MUTUAL FUND FUTURE & OPTION ETF SGB EVENT TRACKER Market Hunt Derivative reports Commodity reports Margin updates Monthly Magazine Blogs
Other candlestick patterns •Three white soldiers •Six bearish candlestick patterns • Hanging man •Shooting star •Bearish engulfing •Evening star •Three black crows •Dark cloud cover Read More www.moneysukh.com STOCK EQUITY IPO MUTUAL FUND FUTURE & OPTION ETF SGB EVENT TRACKER Market Hunt Derivative reports Commodity reports Margin updates Monthly Magazine Blogs
Thank You Contact us: 96382-37000 Mansukh Securities and Finance Limited: SEBI Registration Number-INZ000164537 ( Members- NSE,BSE,MCX, ),IN-DP-72-2015 ( DP-NSDL, CDSL ) Mansukh Stock Brokers Limited : SEBI Registration Number- INZ000164937 ( Members -BSE ), IN-DP-36-2015 Mansukh Commodity Futures Private Limited : SEBI Registration Number-INZ000063032 ( Members- NCDEX ) Mansukh IFSC Broking Private Limited : SEBI Registration Number- INZ000099432 (Members- NSE IFSC, INDIA INX)Procedure to file a complaint on SEBI SCORES: Register on SCORES portal. Mandatory details for filing complaints on SCORES: Name, PAN, Address, Mobile Number, E-mail ID. Benefits: Effective Communication, Speedy redressal of the grievances Investments in securities market are subject to market risks; read all the related documents carefully before investing. www.moneysukh.com STOCK EQUITY IPO MUTUAL FUND FUTURE & OPTION
Related Resources What Is Short Covering In Stock Market & How To Identify Rally? • Importance Of Volume In Technical Analysis: Use & Role In Trading • What Is Short Selling & How Does It Work: Is It Good Or Bad? • Trading or Investing Which is Better and More Profitable? • Best Algo Trading Platform and Trading Strategies • Best Intraday Algo Strategy • USD INR Options Trading Strategies • How to Read, Analyse & Use Candlestick Chart • STOCK EQUITY IPO MUTUAL FUND FUTURE & OPTION ETF SGB EVENT TRACKER Market Hunt Derivative reports Commodity reports Margin updates Monthly Magazine Blogs