Download
1 / 44
440 likes | 661 Vues
Summary of Last Lecture. Portfolio Risk Analysis & Efficient Portfolio Maps. EFFICIENT PORTFOLIOS, MARKET RISK AND CAPITAL MARKET LINE (CML). Learning Objectives:. After going through this lecture, you would be able to have an understanding of the following topics . Efficient Portfolios,

E N D
Summary of Last Lecture • Portfolio Risk Analysis & Efficient Portfolio Maps
EFFICIENT PORTFOLIOS, MARKET RISK AND CAPITAL MARKET LINE (CML)
Learning Objectives: • After going through this lecture, you would be able to have an understanding of the following topics. • Efficient Portfolios, • Market Risk & CML
Recap: • First we recap the important concepts which we have studied in previous lectures. Portfolio theory is looking at the relationships between the risk and return for portfolios, especially for diversified portfolios. • Total Stock Return = Dividend Yield + Capital Gain Yield
Recap: • You should recall this from the Gordon formula that we learnt in the share valuation. We spoke about the total risk for the stock and we said that it is equal to the company’s risk plus the market risk. • Total Risk = Diversifiable Risk + Market Risk
Recap: • We mentioned that on the basis of experimental studies that if we invest in many stocks which are not correlated to each other then it is possible to reduce overall risk for your investment as a whole.
Recap: • We called this portfolio or collection of stocks. 7 Stocks are a good number for diversification & 40 Stocks are enough for eliminating Company Risk & Minimizing Total Risk.
Recap: • Now, in the portfolio theory model which we are going to discuss the major assumption is that the rational investors in the market place maintain diversified portfolios.
Recap: • We discussed in the previous lecture about calculating expected return on the portfolio and we mentioned that it is simply the weighted average of return of each stock in the portfolio. The formula • 2-Stock Portfolio’s Expected Return = rP * = xArA + xBrB
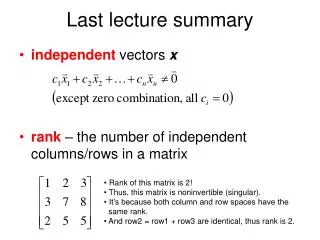
3-Stock Portfolio Risk Formula • It is mentioned in the previous lecture that we can calculate the risk of larger portfolio using the matrix approach. • Matrix for Calculating Portfolio Risk: Covariance Terms (Non-Diagonal Boxes) measures (1) Magnitude of movement (Standard Deviation) and (2) Closeness of movement (Correlation Coefficient) between any two stocks in the portfolio.
3-Stock Portfolio Risk Formula • To compute the Portfolio Variance for a 3-Stock Portfolio, just add up all the terms in every box. To compute the Portfolio Risk (Standard Deviation), simply take the Square Root of the Variance.
3-Stock Portfolio Risk Formula • You can extend this Matrix Approach to calculate the Risk for a Portfolio consisting of any number of stocks. •Terms in Boxes on Diagonal (Top Left to Bottom Right) are called “VARIANCE” terms associated with individual magnitude of risk for each stock.
3-Stock Portfolio Risk Formula •Terms in all other (or NON-DIAGONAL) Boxes are called “COVARIANCE” terms which account for affect of one stock’s movement on another stock’s movement. These represent the magnitude or size of the movement between the two stocks. There are two parts for this covariance terms
3-Stock Portfolio Risk Formula • Both standard deviation and covariance are important to calculate the size of the movement of both stock A and B.
3-Stock Portfolio Risk Formula • In other words, if covariance is large then a pair of stock moves a lot and they also move together. Correlation coefficient is the measure that how closely they move Standard deviation tells us that how much they move.
3-Stock Portfolio Risk Formula • We have discussed in the previous lecture about the efficient portfolio map and the efficient frontier.
3-Stock Portfolio Risk Formula • If we plot the risk and return for the portfolio whose correlation coefficient is negative then we come up with a hook shape curve and it tells us that it is possible to increase the return on portfolio & at same time reduce the risk which is ideal because the objective is to maximize the return and to minimize the risk.
3-Stock Portfolio Risk Formula • But in conclusion of last lecture we said that there is a whole line with infinite number of points that represents an efficient frontier and every single combination or mix of the portfolio on this line represents an efficient combination.
3-Stock Portfolio Risk Formula • But this does not help us very much why because we do not know which one of these mix is the best. So, the first ting we are going to figure out is that what optimal mix of the portfolio is.
3-Stock Portfolio Risk Formula • The starting point to figure out this is to realize that if you have a portfolio of stocks then every investor have access to another portfolio and that portfolio is the portfolio of T bills and we are going to assume that every body have the option of investing in the T-Bills that give them the risk free rate of return.
3-Stock Portfolio Risk Formula • For Pakistan, we consider that figure to be 10%. So, this is the starting point to figure out that what is the optimal portfolio mix is. The realization that if your portfolio is giving you the return which is less then risk free rate of return then why would you investing in that portfolio and you would choose to invest in T-bills.
3-Stock Portfolio Risk Formula • By using this understanding, let’s take another look on risk and return portfolio frontier model and see that how we can use this fact to find the optimal portfolio mix and we take look at 3 stock portfolio consisting of stock A, B and C and added to that we will give ourselves the option of investing in a T-bill portfolio wherever stocks are not providing sufficient return.
3-Stock Portfolio Risk Formula • So, if we look at the efficient portfolio map you will see that Portfolio risk is on X- axis and the portfolio return on Y- axis.
Picking Most Efficient Portfolio Capital MarketLine (CML) & T-Bill Portfolio • The efficient frontier for the 3 stock portfolio is the overarching largest hook shaped curve and also remember that closed combination of the all the hook shaped curves forms a parachute like shape and any one of the points inside that parachute is a possible mix or combination of different stocks that you can have in your portfolio.
Picking Most Efficient Portfolio Capital MarketLine (CML) & T-Bill Portfolio • However, the most efficient combinations lie on the efficient frontier line and the next logical step we are going to take is to figure out what is the best point on the efficient frontier.
Picking Most Efficient Portfolio Capital MarketLine (CML) & T-Bill Portfolio • As it is mentioned that we will assume that we have access to T- bill portfolio which offers a risk free rate of return of 10% and that will be the starting point of our capital market line (CML).
Picking Most Efficient Portfolio Capital MarketLine (CML) & T-Bill Portfolio • Wherever this line if you extend from the 10 % point from y-axis touches the efficient frontier line and is tangent to it is the point for the “Optimal Portfolio Mix.” This point is shown as a large dot in the above figure.
Picking Most Efficient Portfolio Capital MarketLine (CML) & T-Bill Portfolio • If you look at the location of this large dot on the efficient frontier you can see that it lies closer to the Stock B and Stock A. Therefore, there is larger percentage of stock A and B in this optimal portfolio mix.
Picking Most Efficient Portfolio Capital MarketLine (CML) & T-Bill Portfolio • Approximately, the optimal portfolio mix consist of 50% Stock A, 30% Stock B, and 20% Stock C. It is important to remember that we have the option of investing in the T-bill portfolio which offers a risk free rate of return.
Picking Most Efficient Portfolio Capital MarketLine (CML) & T-Bill Portfolio • And the expected rate of return is 10%. Therefore, if the returns on this portfolio decrease 10% then the investor will invest in the risk free T –bills portfolio.
Picking Most Efficient Portfolio Capital MarketLine (CML) & T-Bill Portfolio • Whichever portfolio offers lowest coefficient of variation is the better portfolio. The CML represents different combinations that you can pick in the risk free as well as stock portfolio.
Picking Most Efficient Portfolio Capital MarketLine (CML) & T-Bill Portfolio • Thus CML represents combination of efficient portfolio in the capital market. It is the important point remembers that According to the Portfolio Theory, Efficient Portfolios are Fully Diversified and they must lie on the CML Line. Now, it is also possible simply come up with the equation for the CML.
Picking Most Efficient Portfolio Capital MarketLine (CML) & T-Bill Portfolio • CML Equation: rP* = rRF + [(rM - rRF) / σM] σP • rRF= risk free rate of return • rM = expected rate of return for the market of all possible stock • σM = risk of the market • σP = risk of stock portfolio
Picking Most Efficient Portfolio Capital MarketLine (CML) & T-Bill Portfolio • The Expected Return on an Investment in a Common Share is not guaranteed or certain. The Price and Dividend can vary so we can guess what the Possible future Returns (or Outcomes) might be and assign probabilities to each.
Picking Most Efficient Portfolio Capital MarketLine (CML) & T-Bill Portfolio • Uncertainty about Future Expected Return on Investment gives rise to Probability Distribution of Possible Outcomes. This gives rise to a Spread of Possible Future Returns which is a measure of the Risk or Uncertainty or Standard Deviation.
Picking Most Efficient Portfolio Capital MarketLine (CML) & T-Bill Portfolio • We can apply this concept to the single stock or a portfolio of a many stocks. When we talk about the expected return on a single stock then we are saying that it is the combination of the dividend gain yield and the capital gain yield.
Picking Most Efficient Portfolio Capital MarketLine (CML) & T-Bill Portfolio • When we talk about the expected return for the portfolio then we consider expected return for each stock in that portfolio and assign proportionate amount of weight age based on the fraction of the investment in a particular stock compare to the total value of the portfolio.
Picking Most Efficient Portfolio Capital MarketLine (CML) & T-Bill Portfolio • Furthermore, the individual risk of every investment affects the risk of every other investment in the portfolio! The Overall Portfolio Risk decreases as the number of investments increase up to the point that the Company Specific or Unique Risk has been totally eliminated.
Picking Most Efficient Portfolio Capital MarketLine (CML) & T-Bill Portfolio • i.e. About 40 uncorrelated stocks. In this Range it is possible to Increase Return and Reduce Risk! After that, the Portfolio is assumed to be Fully Diversified and any additional investment will only contribute to the Market Risk which can not be eliminated.
Summary • Efficient Portfolios, • Market Risk & CML