Download
1 / 1
20 likes | 177 Vues
NEO Impact Hazard Scales in the Context of Other Hazard Scales. Poster Talk, AAS Division for Planetary Sciences, Birmingham AL, Tuesday, October 8, 2002. Brendan M. Mulligan . Clark R. Chapman. Queen’s Univ., Kingston, Ont. & CIRES, Univ. Colorado, Boulder CO.

E N D
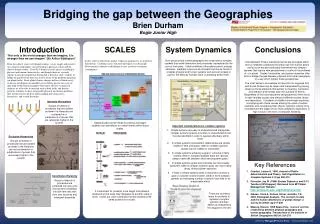
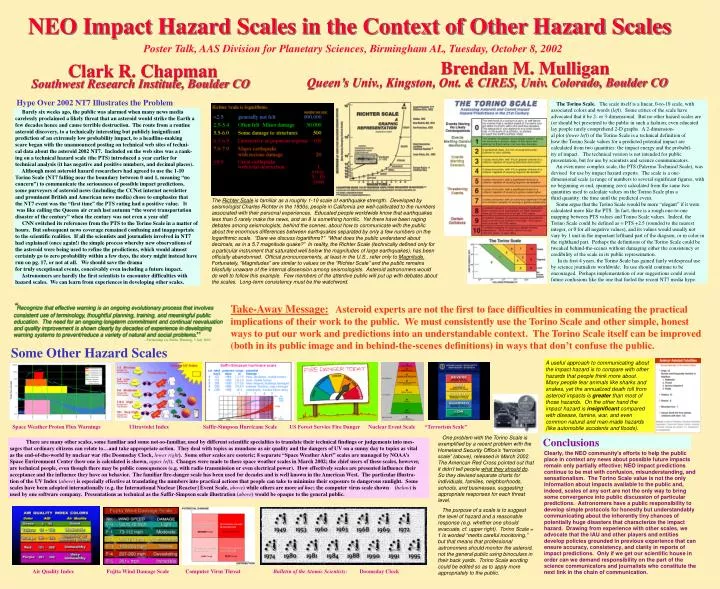
NEO Impact Hazard Scales in the Context of Other Hazard Scales Poster Talk, AAS Division for Planetary Sciences, Birmingham AL, Tuesday, October 8, 2002 Brendan M. Mulligan Clark R. Chapman Queen’s Univ., Kingston, Ont. & CIRES, Univ. Colorado, Boulder CO Southwest Research Institute, Boulder CO Hype Over 2002 NT7 Illustrates the Problem The Torino Scale. The scale itself is a linear, 0-to-10 scale, with associated colors and words (left). Some critics of the scale have advocated that it be 2- or 3-dimensional. But no other hazard scales are (or should be) presented to the public in such a fashion; even educated lay people rarely comprehend 2-D graphs. A 2-dimension- al plot (lower left) of the Torino Scale is a technical definition of how the Torino Scale values for a predicted potential impact are calculated from two quantities: the impact energy and the probabil- ity of impact. The technical version is not intended for public presentation, but for use by scientists and science communicators. An even more complex scale, the PTS (Palermo Technical Scale), was devised for use by impact hazard experts. The scale is a one-dimensional scale (a range of numbers to several significant figures, with no beginning or end, spanning zero) calculated from the same two quantities used to calculate values on the Torino Scale plus a third quantity: the time until the predicted event. Some argue that the Torino Scale would be more “elegant” if it were calculated more like the PTS. In fact, there is a rough one-to-one mapping between PTS values and Torino Scale values. Indeed, the Torino Scale could be defined as = PTS +2.5 (rounded to the nearest integer, or 0 for all negative values), and its values would usually not vary by 1 unit in the important lefthand part of the diagram, or in color in the righthand part. Perhaps the definitions of the Torino Scale could be tweaked behind-the-scenes without damaging either the consistency or credibility of the scale in its public representation. In its first 4 years, the Torino Scale has gained fairly widespread use by science journalists worldwide. Its use should continue to be encouraged. Perhaps implementation of our suggestions could avoid future confusions like the one that fueled the recent NT7 media hype. Barely six weeks ago, the public was alarmed when many news media carelessly proclaimed a likely threat that an asteroid would strike the Earth a few decades hence and cause terrible destruction. The route from a routine asteroid discovery, to a technically interesting but publicly insignificant prediction of an extremely low probability impact, to a headline-making scare began with the unannounced posting on technical web sites of techni- cal data about the asteroid 2002 NT7. Included on the web sites was a rank-ing on a technical hazard scale (the PTS) introduced a year earlier for technical analysis (it has negative and positive numbers, and decimal places). Although most asteroid hazard researchers had agreed to use the 1-10 Torino Scale (NT7 falling near the boundary between 0 and 1, meaning “no concern”) to communicate the seriousness of possible impact predictions, some purveyors of asteroid news (including the CCNet internet newsletter and prominent British and American news media) chose to emphasize that the NT7 event was the “first time” the PTS rating had a positive value. It was like calling the Queens air crash last autumn “the worst transportation disaster of the century” when the century was not even a year old! CNN switched its references from the PTS to the Torino Scale in a matter of hours. But subsequent news coverage remained confusing and inappropriate to the scientific realities. If all the scientists and journalists involved in NT7 had explained (once again!) the simple process whereby new observations of the asteroid were being used to refine the predictions, which would almost certainly go to zero probability within a few days, the story might instead have run on pg. 17, or not at all. We should save the drama for truly exceptional events, conceivably even including a future impact. Astronomers are hardly the first scientists to encounter difficulties with hazard scales. We can learn from experiences in developing other scales. The Richter Scale is familiar as a roughly 1-10 scale of earthquake strength. Developed by seismologist Charles Richter in the 1930s, people in California are well-calibrated to the numbers associated with their personal experiences. Educated people worldwide know that earthquakes less than 5 rarely make the news, and an 8 is something horrific. Yet there have been raging debates among seismologists, behind the scenes, about how to communicate with the public about the enormous differences between earthquakes separated by only a few numbers on the logarithmic scale. “Dare we discuss logarithms?” “What does the public understand about decimals, as in a 5.7 magnitude quake?” In reality, the Richter Scale (technically defined only for a particular instrument that saturated well below the magnitudes of large earthquakes), has been officially abandonned. Official pronouncements, at least in the U.S., refer only to Magnitude. Fortunately, “Magnitudes” are similar to values on the “Richter Scale” and the public remains blissfully unaware of the internal dissension among seismologists. Asteroid astronomers would do well to follow this example. Few members of the attentive public will put up with debates about the scales. Long-term consistency must be the watchword. “Recognize that effective warning is an ongoing evolutionary process that involves consistent use of terminology, thoughtful planning, training, and meaningful public education. The need for an ongoing long-term commitment and continual reevaluation and quality improvement is shown clearly by decades of experience in developing warning systems to prevent/reduce a variety of natural and social problems. Take-Away Message: Asteroid experts are not the first to face difficulties in communicating the practical implications of their work to the public. We must consistently use the Torino Scale and other simple, honest ways to put our work and predictions into an understandable context. The Torino Scale itself can be improved (both in its public image and in behind-the-scenes definitions) in ways that don’t confuse the public. ” -- Partnership for Public Warning, 5 July 2002 Some Other Hazard Scales A useful approach to communicating about the impact hazard is to compare with other hazards that people think more about. Many people fear animals like sharks and snakes, yet the annualized death toll from asteroid impacts is greater than most of those hazards. On the other hand the impact hazard is insignificant compared with disease, famine, war, and even common natural and man-made hazards (like automobile accidents and floods). Space Weather Proton Flux Warnings Ultraviolet Index Saffir-Simpson Hurricane Scale US Forest Service Fire Danger Nuclear Event Scale “Terrorism Scale” One problem with the Torino Scale is exemplified by a recent problem with the Homeland Security Office’s “terrorism scale” (above), released in March 2002. The American Red Cross pointed out that it didn’t tell people what they should do. So they devised separate charts for individuals, families, neighborhoods, schools, and businesses, suggesting appropriate responses for each threat level. The purpose of a scale is to suggest the level of hazard and a reasonable response (e.g. whether one should evacuate, cf. upper right). Torino Scale = 1 is worded “merits careful monitoring,” but that means that professional astronomers should monitor the asteroid, not the general public using binoculars in their back yards. Torino Scale wording could be edited so as to apply more appropriately to the public. Conclusions There are many other scales, some familiar and some not-so-familiar, used by different scientific specialties to translate their technical findings or judgements into mes- sages that ordinary citizens can relate to…and take appropriate action. They deal with topics as mundane as air quality and the dangers of UV on a sunny day to topics as vital as the end-of-the-world by nuclear war (the Doomsday Clock, lower right). Some other scales are esoteric; 8 separate “Space Weather Alert” scales are managed by NOAA’s Space Environment Center (how one is calculated is shown, upper left). Changes were made to these space weather scales in March 2002; the chief users of these scales, however, are technical people, even though there may be public consequences (e.g. with radio transmission or even electrical power). How effectively scales are presented influence their acceptance and the influence they have on behavior. The familiar fire-danger scale has been used for decades and is well known in the American West. The particular illustra- tion of the UV Index (above) is especially effective at translating the numbers into practical actions that people can take to minimize their exposure to dangerous sunlight. Some scales have been adopted internationally (e.g. the International Nuclear [Reactor] Event Scale, above) while others are more ad hoc; the computer virus scale shown (below) is used by one software company. Presentations as technical as the Saffir-Simpson scale illustration (above) would be opaque to the general public. Air Quality Index Fujita Wind Damage Scale Computer Virus Threat Bulletin of the Atomic Scientists: Doomsday Clock