Decision Trees
Decision Trees. November 18, 2013. Example: we have a machine which may break down at any time over the next three years. We can replace it now, at a cost of $40,000, or we can keep it in service till it breaks. That will cost us $10,000 in lost production, and we will have to pay to

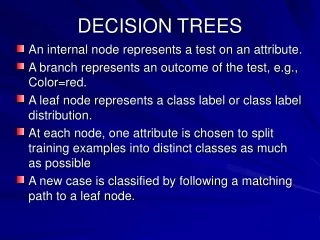
Decision Trees
E N D
Presentation Transcript
Decision Trees November 18, 2013
Example: we have a machine which may break down at any time over the next three years. We can replace it now, at a cost of $40,000, or we can keep it in service till it breaks. That will cost us $10,000 in lost production, and we will have to pay to have it replaced. Every year, there is a 30% chance that the cost of a replacement will go up by $5,000, though we don’t expect there to be more than one such increase in the next three years. Our MARR is 20%.
Example: we have a machine which may break down at any time over the next three years. We can replace it now, at a cost of $40,000, or we can keep it in service till it breaks. That will cost us $10,000 in lost production, and we will have to pay to have it replaced. Every year, there is a 30% chance that the cost of a replacement will go up by $5,000, though we don’t expect there to be more than one such increase in the next three years. Our MARR is 20%.
Your company has developed a new design of mobile phone. You need to decide whether to manufacture and market it in China or North America. If you manufacture in China, the fixed costs will be $4,000,000, and the variable costs per phone will be $15. If you manufacture in North America, the fixed costs may be anywhere from $3,000,000 to $4,000,000, and the variable costs per phone will be between $15 and $20. Shipping across the Pacific will add $10 per phone. If you sell at $30 in China, you expect to sell 300,000-400,000 units. If you sell for $40, you can expect these figures to be halved. In North America, if you sell at $40 you expect to sell 100,000 to 300,000, and these figures will be halved if you sell at $50.
China North America Start with a decision node…
Sell in China Make in China Sell in NA Sell in China Make in NA Sell in NA Make further decisions…
Sell China $30 $40 Sell NA $40 $50 Sell China $30 $40 Sell NA $40 $50 Make further decisions…
CC30 Sell China $30 $40 Sell NA $40 $50 Sell China $30 $40 NN40 Sell NA $40 $50 NN50 Label leaf nodes…
Sell 300,000 CC30 Sell 400,000 Construct `chance’ trees from leaf nodes…
Sell 300,000 PW = -4,000+300(30-15) = -4,000+4,500 = 500 CC30 PW = -4,000+400(30-15) = -4,000+6,000 = 2,000 Sell 400,000 Calculate PW (omit (P/F) factors, since they’re the same on all branches; figures in $000’s)
Sell 300,000 PW = 500 E(x)=1,250 CC30 Sell 400,000 PW = 2,000 Calculate average PW
Sell 300,000 PW = 500 E(x)=1,250 CC30 Sell 400,000 PW = 2,000 Calculate variance and standard deviation Var(x) = 0.5 × (1,250-500)2 + 0.5 × (1,250-2,000)2 = 562,500 s.d. = 750
Sell 100,000 VC 15 Sell 300,000 Fixed cost 300,000 Sell 100,000 VC 20 NN40 Sell 300,000 Sell 100,000 VC 15 Sell 300,000 Fixed cost 400,000 Sell 100,000 VC 20 Sell 300,000 For some leaf nodes, the process is more complicated…
Sell 100K PW=-3,000+100(40-15) = -500 VC 15 Sell 300K PW=-3,000+300(40-15) = 5,500 FC 300K VC 20 NN40
Sell 100K PW=-3,000+100(40-15) = -500 VC 15 Sell 300K PW=-3,000+300(40-15) = 5,500 FC 300K PW= -1,000 VC 20 NN40 PW= 3,000 PW= -1,500 FC 400K PW= 4,500 PW= -2,000 PW= 2,000
Sell 100K PW= -500 VC 15 E(x) = 1,250 Var = 4,570,000 s.d. = 2,137 Sell 300K PW= 5,500 FC 300K PW= -1,000 VC 20 NN30 PW= 3,000 PW= -1,500 FC 400K PW= 4,500 PW= -2,000 PW= 2,000
Mean = 1,250, sd = 750 Sell China $30 $40 Mean = 375, sd = 625 Make in China Mean = -1,000, sd = 1,500 Sell NA $40 $50 Mean = -1,500, sd = 1,250 Sell China $30 $40 Make in NA Mean = 1,250, sd = 2,137 Sell NA $40 $50 Mean = -250, sd = 1,639 Mark these results on the decision tree
Mean = 1,250, sd = 750 Sell China $30 $40 Mean = 375, sd = 625 Make in China Mean = -1,000, sd = 1,500 Sell NA $40 $50 Mean = -1,500, sd = 1,250 Sell China $30 $40 Make in NA Mean = 1,250, sd = 2,137 Sell NA $40 $50 Mean = -250, sd = 1,639 Mark these results on the decision tree
Mean = 1,250, sd = 750 Sell China $30 $40 Mean = 375, sd = 625 Make in China Mean = -1,000, sd = 1,500 Sell NA $40 $50 Mean = -1,500, sd = 1,250 Sell China $30 $40 Make in NA Mean = 1,250, sd = 2,137 Sell NA $40 $50 Mean = -250, sd = 1,639 The China/China option is mean-variance dominant
Illustrative example: How to calculate π using a shotgun
Step One: Draw a circle in a square
2 Note that, if the side of the square is 2, then the area of the square is 4 and the area of the circle is π
Count the number of holes inside the circle and the number inside the square. Their ratio approximates π/4
In this case, we find that π is about 4 × 10 ⁄ 13 = 3.08
j = 0; for (i=1; i <= 1000000; i++) { x = rnd(); y = rnd(); if ((x2 + y2) < 1) j++; pi_Estimate = 4 * real(i)/real(j) }
j = 0; for (i=1; i <= 1000000; i++) { x = rnd(); y = rnd(); if ((x2 + y2) < 1) j++; pi_Estimate = 4 * real(i)/real(j) } In the square
j = 0; for (i=1; i <= 1000000; i++) { x = rnd(); y = rnd(); if ((x2 + y2) < 1) j++; pi_Estimate = 4 * real(i)/real(j) } Is it in the circle?
Your company has developed a new design of mobile phone. You need to decide whether to manufacture and market it in China or North America. If you manufacture in China, the fixed costs will be $4,000,000, and the variable costs per phone will be $15. If you manufacture in North America, the fixed costs may be anywhere from $3,000,000 to $4,000,000, and the variable costs per phone will be between $15 and $20. Shipping across the Pacific will add $10 per phone. If you sell at $30 in China, you expect to sell 300,000-400,000 units. If you sell for $40, you can expect these figures to be halved. In North America, if you sell at $40 you expect to sell 100,000 to 300,000, and these figures will be halved if you sell at $50. It will take 2 to 4 years to begin manufacture, and your MARR is between 10 and 15%.
Step 1: Build the deterministic model (this may be a computer program or set of spreadsheet formulae) PW(NN30) = (Fixed_Cost – Sales(30 -Variable_Cost))(P/F, i, N) PW(NN40) = (Fixed_Cost – Sales(40 -Variable_Cost))(P/F, i, N) Do a sample calculation to make sure it works.
Step 2: Decide what the probability distribution is for each random variable: p(Fixed Cost) $3M $3.5M $4M Fixed Cost
Step 3: The random numbers you are going to generate will be uniformly distributed between 0 and 1. This is fine if the variable you are modelling happens to be uniformly distributed between 0 and 1, but what if it’s normally distributed between $3M and $4M?
p(Fixed Cost < x) $3M $4M Fixed Cost First form the cumulative distribution function
p(x<x3) p(x<x2) p(x<x1) $3M $4M x1 x2 x3 Then discretize it
p(x<x3) z p(x<x2) p(x<x1) $3M $4M x1 x2 x3 Pick z = rnd()
p(x<x3) z p(x<x2) p(x<x1) X $3M $4M x1 x2 x3 Now if p(x<x2) < z < p(x<x3), X =(x2+x3)/2
Step 3a: The random numbers you are going to generate will be uniformly distributed between 0 and 1. This is fine if the variable you are modelling happens to be uniformly distributed between 0 and 1, but what if it’s a discrete random variable?
For example: ``There is a 30% probability that the government will levy a surcharge on phones imported from China.’’ Let z = rnd(); if z > 0.3, no surcharge
In this way, we generate random estimates for each parameter in the problem. Then we plug these parameters into the deterministic model, and get one possible value of the present worth. PW(NN30)1 = (Fixed_Cost1– Sales1(30 -Variable_Cost1))(P/F, i1, N1) Now do this a thousand times. PW(NN30)2 = (Fixed_Cost2– Sales2(30 -Variable_Cost2))(P/F, i2, N2) . . . PW(NN30)1000 = (Fixed_Cost1000 – Sales1000(30 -Variable_Cost1000))(P/F, i1000, N1000)