Download
1 / 35
360 likes | 506 Vues
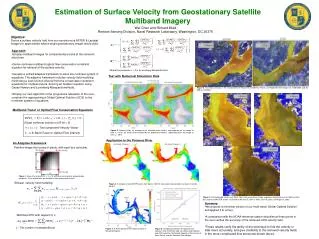
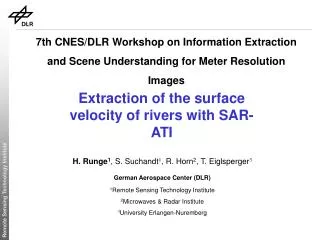
7th CNES/DLR Workshop on Information Extraction and Scene Understanding for Meter Resolution Images. Extraction of the surface velocity of rivers with SAR-ATI. H. Runge 1 , S. Suchandt 1 , R. Horn 2 , T. Eiglsperger 3 German Aerospace Center (DLR) 1 Remote Sensing Technology Institute

E N D
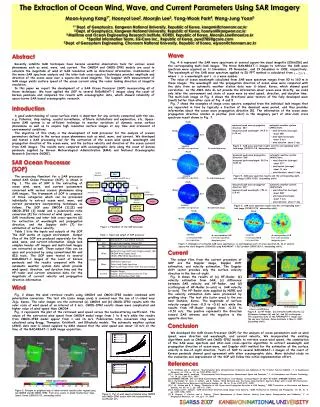
7th CNES/DLR Workshop on Information Extraction and Scene Understanding for Meter Resolution Images Extraction of the surface velocity of rivers with SAR-ATI H. Runge1, S. Suchandt1, R. Horn2, T. Eiglsperger3 German Aerospace Center (DLR) 1Remote Sensing Technology Institute 2Microwaves & Radar Institute 3University Erlangen-Nuremberg
Why do we need measurement of river surface currents with remote sensing? • The surface velocity is one important parameter to measure the river run-off • River discharge is the only parameter in the water cycle that can be measured integrated over a large area. • River discharge is a sensitive parameter for climate changes. • With the rapid growth of world population the fresh water resources are of vital interest. • Gauging stations can not be maintained in all parts of the world. • From some countries run-off data are not made available. • In case of flooding better run-off predictions are necessary.
vs, az, Flight Track d A2 A1 R0 z h x, vx y, vy Rground Moving Target Ground Track SAR Along-Track Interferometry Interferometric phase:
vy az az rg The „Train Off the Track Effect“ A moving target with across-track motion appears displaced in azimuth direction in the SAR image. The signal from the water surface will appear displaced & superimposed on clutter at the river bank in the focused SAR image.
Considerable Surface Roughness is Required Higher return over rough surface Over smooth water the microwaves are reflected away from the sensor
Drainage Basin of the River Isar DLR test sites where in-situ measurements have been performed by the Bavarian Hydrological Office Munich DLR Gauge „Puppling“ site „Lenggries“ site „Kochel“
ESAR Data of Puppling Test Site Coherence Amplitude ATI Phase az slant range
ATI Phase Analysis Pixel with non-zero phase are back projected to their “original” position. Only pixel which are then positioned over the river will be considered.
Result from ATI Analysis Result for ATI current velocity: Pixel analyzed: 61 Min/Max: 2.27 / 0.56 m/s Mean: 1.22 m/s Result from in-situ measurement: Mean: 1,70 m/s
Result from ATI Analysis Result for the current velocity from ATI method: Pixel analyzed: 61 Min/Max: 2.27 / 0.56 m/s Mean: 1.22 m/s Result from in-situ measurement: Mean: 1,70 m/s Due to the superposition with stationary clutter the ATI measurements are biased to lower velocities. The error is 28%.
Simulation of Azimuth Displacement for E-SAR Case river surface velocity [m/s] azimuth displacement 2.5 2.0 1.5 70 m 1.0 0.5 river flow direction az rg The azimuth displacement method is not affected by clutter!
The two SAR channels are used for clutter cancellation Remaining amplitude after complex subtraction of the two channels (DPCA) Original SAR image
Result for the current velocity from the displacement method plus DPCA clutter suppression: Mean displacement: 86m Corresponding velocity : 1.90 m/s Result from in-situ measurement: Mean: 1,70 m/s The difference to the reference measurement has been reduced to 12%!
Wolfratshausen 2006 Data Takes 2 06trafic0208x1_t01 06trafic0209x1_t01 06trafic0211x1_t01 4 06trafic0210x1_t01 3 1
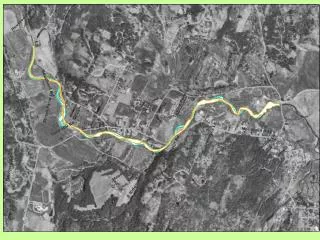
Isar 12/05/06 - Ground Truth Measurements 1-4:Sections where ground truth data where acquired with floaters. N Main river stream with greatest surface roughness
flightdirection Illumination Amplitude image of DT0210x1 Results from 24.11.06: corrected DPCA modeling
flightdirection Illumination Clutter reduction by DPCA filtering Results from 24.11.06: corrected DPCA modeling
flightdirection Illumination Displaced river surface (red line) versus actual flow (blue line) Results from 21.03.07
flightdirection Illumination Surface velocity from displacement Results from 21.03.07
flightdirection Illumination Surface velocity from displacement Results from 21.03.07
flightdirection Illumination Surface velocity from displacement Illumination Results from 21.03.07
flightdirection Illumination Amplitude image of DT0211x1 Results from 18.10.06
flightdirection Illumination Clutter reduction by DPCA filtering Results from 18.10.06
flightdirection Illumination Displaced river surface (red line) versus actual flow (blue line)
flightdirection Illumination Surface velocity from displacement
flightdirection Illumination Surface velocity from displacement Results from 21.03.07, daz reference = area with greatest roughness; slightly corrected DPCA modeling
flightdirection Illumination Surface velocity from displacement Results from 21.03.07, daz reference = area with greatest roughness; slightly corrected DPCA modeling
Conclusions • Due to strong clutter on the river bank the ATI measurements are biased to lower velocities • Clutter cancellation led to a SAR velocity measurement which differ in the order of only 10 to 15% from the in-situ measurements • A 3-channel SAR will allow to do both DPCA and ATI. • With such a system no auxillary information concerning the actual flow direction is required.