Download
1 / 46
460 likes | 568 Vues
Learn about significant figures, scientific notation, measurement, dimensional analysis, error, density, and graphical analysis to understand the precision, accuracy, and uncertainty of measurements in chemistry.

E N D
What You’ll Learn in this Unit • Significant Figures • Scientific Notation • Measurement • Dimensional Analysis • Error • Density • Graphical analysis
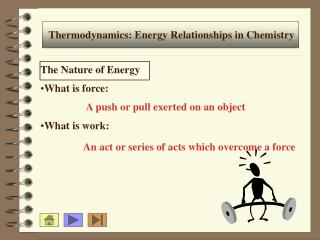
Review of Measurement Terms • Qualitative measurements - words • Quantitative measurements – involves numbers (quantities) • Depends on reliability of instrument • Depends on care with which it is read
Precision vs. Accuracy • Precision- the degree of agreement among several measurements of the same quantity. • Accuracy- the agreement of a particular value with the true value
Uncertainty • Basis for significant figures • All measurements are uncertain to some degree • Random error - equal chance of being high or low- addressed by averaging measurements - expected
Significant Figures • Meaningful digits in a measurement • The number of significant figures in your measurement will tell the reader how exact the instrumentation used • If it is measured or estimated, it has sig figs. • If not it is exact (e.g. 5 apples).
Significant Figures • All numbers 1-9 are significant. • The problem are the ZEROS. • Which ones count and which don’t? • In between numbers 1-9 does • Example: 4001……… has 4 sig figs • Now let me tell you a story…
Left handed Archer • There once was a left handed archer who loved to shoot decimals. Zeros could not stop his arrow but numbers could. • If there is a decimal in the number begin on the left. Go through any zeros, come to the first number then all other numbers that follow are SIGNIFICANT! • →0.0040 • →50.401
No decimals • If a number has no decimals you begin on the right hand side. • Go through any zeros , come to the first number. • Then all numbers after that count • 5000← • 405,000 ←
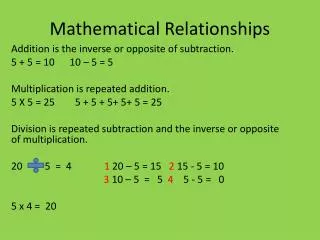
Doing the Math • Multiplication and division, same number of sig figs in answer as the least in the problem • Addition and subtraction, same number of decimal places in answer as least in problem.
Scientific Notation • 100 = 1.0 x 10² • 0.001 = 1.0 x 10⁻³ -- This provides a way to show significant figures.
TOO QUICK FOR YOU! • So here are the rules.. slowly! • Place decimal point after 1st real non-zero integer. (ex) 1.0 NOT 10.0 • Raise 10 to the exponential which equals the number of places you moved.
Scientific Notation • The product of 2.3 x 10 x 10 x 10 equals 2300 (2.3 x 10³) • Note: • Moving the decimal to the left will increase the power of 10 • Moving the decimal to the right will decrease the power of 10
Sample Problems • 2387 • 0.00007031 • 2900000000 • 0.008900 • 90100000 • 0.00000210
Answers • 2.387 x 10³ • 7.031 X 10⁻⁵ • 2.9 x 10⁹ • 8.900 X 10⁻³ • 9.01 X 10⁷ • 2.10 X 10⁻⁶
Scientific Notation • Multiplication and Division • Use of a calculator is permitted • use it correctly • No calculator? Multiply the coefficients, and add the exponents (3 x 104) x (2 x 102) = (2.1 x 103) x (4.0 x 10-7) = 6 x 10⁶ 8.4 x 10⁻⁴
Scientific Notation • Multiplication and Division • In division, divide the coefficients, and subtract the exponent in the denominator from the numerator 3.0 x 10⁵ 6.0 x 10² 5 x 102 =
Scientific Notation • Addition and Subtraction • Before numbers can be added or subtracted, the exponents must be the same • Calculators will take care of this • Doing it manually, you will have to make the exponents the same- it does not matter which one you change. • (6.6 x 10⁻⁸) + (4.0 x 10⁻⁹) = • (3.42 x 10⁻⁵) – (2.5 x 10⁻⁶) = 7 x 10⁻⁸ 3.17 x 10⁻⁵
Measurement • Every measurement has two parts • Number with the correct sig - figs • Scale (unit) • We use the Systeme Internationale (SI).
Metric Base Units • Mass - kilogram (kg) • Length- meter (m) • Volume- (L) • Time - second (s) • Temperature- Kelvin (K) • Electric current- ampere (amp, A) • Amount of substance- mole (mol) • Energy – joule (j)
Prefixes • giga- G 1,000,000,000 109 • mega - M 1,000,000 106 • kilo - k 1,000 103 • deci- d 0.1 10-1 • centi- c 0.01 10-2 • milli- m 0.001 10-3 • micro- m 0.000001 10-6 • nano- n 0.000000001 10-9
Dimensional Analysis Using Units to solve problems
Dimensional Analysis • Use conversion factors to change the units • Conversion factors = 1 • 1 foot = 12 inches (equivalence statement) • 12 in=1= 1 ft. 1 ft. 12 in • 2 conversion factors • multiply by the one that will give you the correct units in your answer.
Example Problem • The speed of light is 3.00 x 10⁸ m/s. How far will a beam of light travel in 1.00 ns? • Well, we know that 1.00 ns = 10-9 seconds • (3.00 x 10⁸ m) X (10-9 s) = 3.00 x 10⁻⁹ m/ns s (1.00 ns)
Example Problems • 11 yards = 2 rod • 40 rods = 1 furlong • 8 furlongs = 1 mile • The Kentucky Derby race is 1.25 miles. How long is the race in rods, furlongs, meters, and kilometers? • A marathon race is 26 miles, 385 yards. What is this distance in rods, furlongs, meters, and kilometers?
Volume • The space occupied by any sample of matter • Calculated for a solid by multiplying the length x width x height • SI unit = cubic meter (m3) • Everyday unit = Liter (L), which is non-SI
Units of Mass • Mass is a measure of the quantity of matter • Weight is a force that measures the pull by gravity- it changes with location • Mass is constant, regardless of location. • The SI unit of mass is the kilogram (kg), even though a more convenient unit is the gram • Measuring instrument is the balance scale
Density • Which is heavier- lead or feathers? • It depends upon the amount of the material • A truckload of feathers is heavier than a small pellet of lead • The relationship here is between mass and volume- called Density
Density • Ratio of mass to volume • D = m/V • Common units are g/mL, or possibly g/cm3, (or g/L for gas) • Useful for identifying a compound • Useful for predicting weight • An intensive property- does not depend on what the material is
Things related to density • density of corn oil is 0.89 g/mL and water is 1.00 g/mL • What happens when corn oil and water are mixed? • Why? • Will lead float?
Example Problem • An empty container weighs 121.3 g. Filled with carbon tetrachloride (density 1.53 g/cm3 ) the container weighs 283.2 g. What is the volume of the container?
Density and Temperature • What happens to density as the temperature increases? • Mass remains the same • Most substances increase in volume as temperature increases • Thus, density generally decreases as the temperature increases
Density and water • Water is an important exception • Over certain temperatures, the volume of water increases as the temperature decreases • Does ice float in liquid water? • Why?
Specific Gravity • A comparison of the density of an object to a reference standard (which is usually water) at the same temperature • Water density at 4 oC = 1 g/cm3
Formula Specific gravity = D of substance (g/cm3) D of water (g/cm3) • Note there are no units left, since they cancel each other • Measured with a hydrometer • Uses? • Gem purity • differentiating between different types of crude oils/gasoline • urine tests for concentration of all chemicals in your urine
Temperature • Heat moves from warmer object to the cooler object • Glass of iced tea gets colder? • Remember that most substances expand with a temperature increase? • Basis for thermometers
Temperature scales • Celsius scale- named after a Swedish astronomer • Uses the freezing point (0 oC) and boiling point (100 oC) of water as references • Divided into 100 equal intervals, or degrees Celsius
Temperature scales • Kelvin scale (or absolute scale) • Named after Lord Kelvin • K = oC + 273 • A change of one degree Kelvin is the same as a change of one degree Celsius • No degree sign is used
Temperature scales • Water freezes at 273 K • Water boils at 373 K • 0 K is called absolute zero, and equals –273 oC
Temperature • A measure of the average kinetic energy • Different temperature scales, all are talking about the same height of mercury. • In lab take the reading in ºC then convert to our SI unit Kelvin • ºC + 273 = K
100ºC = 212ºF 0ºC = 32ºF 100ºC = 180ºF 1ºC = (180/100)ºF 1ºC = 9/5ºF
Example problem • A 55.0 gal drum weighs 75.0 lbs. when empty. What will the total mass be when filled with ethanol? density 0.789 g/cm3 1 gal = 3.78 L • 1 lb = 454 g
Error Calculations Error = Experimental value- accepted value % error = [error] accepted value X 100
Graphing • The relationship between two variables is often determined by graphing • A graph is a “picture” of the data
Graphing Rules – 10 items • Plot the independent variable on the x-axis (abscissa) – the horizontal axis. Generally controlled by the experimenter • Plot the dependent variableon the y-axis (ordinate) – the vertical axis. 3. Label the axis. • Quantities (temperature, length, etc.) and also the proper units (cm, oC, etc.) 4. Choose a range that includes all the results of the data
Graphing Rules 5. Calibrate the axis (all marks equal) 6. Enclose the dot in a circle (point protector) 7.Give the graph a title (telling what it is about) 8. Make the graph large – use the full piece of paper 9. Indent your graph from the left and bottom edges of the page 10. Use a best fit line, do not connect points