Download
1 / 22

E N D
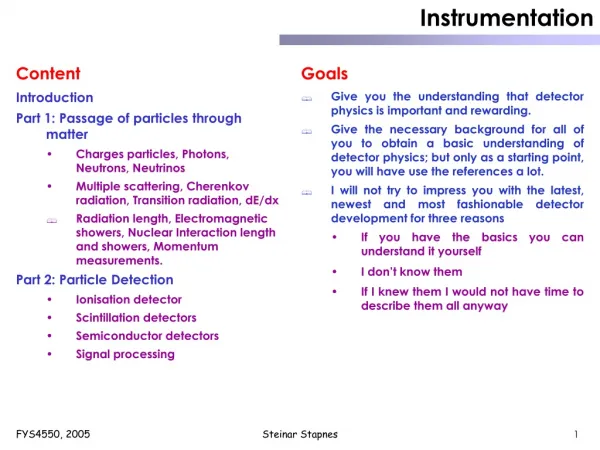
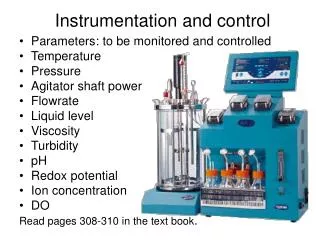
INSTRUMENTATION AND MEASUREMENT M.PRASAD NAIDU Msc Medical Biochemistry, Ph.D Research scholar.
Abstract • Why Instrumentation and Measurement ? • Instrumentation Techniques • Resources • Data Analysis • Case Study: Paradyn • Guiding Principles • System Overview • W3 Search Model
Why Instrumentation and Measurement ? • Gathering data to improve the next execution of the program. • Guiding scheduling decisions • Adapting to computations while in execution
Instrumentation Techniques • Program Instrumentation Techniques • Manual : Programmer inserted directives • Automatic : No direct user involvement • Binary Rewriting • Dynamic Instrumentation • Processor Instrumentation Techniques • Information includes timers, memory system performance, processor usage, etc. • Available mostly through special registers or memory mapped location. • Example : Pentium Pro provides performance data through MSRs. These registers include 64 bit cycle clock and counts of memory read /write, L1 cache misses, pipeline flushes, etc. • Hardware assisted trace generation.
Operating System Instrumentation Techniques • Information includes behavior of virtual memory, file system, file cache etc. • Instrumentation in the form of APIs for applications to access these variables. • Network Instrumentation Techniques • Ways of measuring • Passive • Example: RMON protocol defines SNMP MIB variables to report traffic statistics over hubs and switches. • Active • Example: Ping, NWS in grid style computing.
Data Storage Representation • Scalars • Counters • Times • Traces • Vector series
Resources • Software Abstractions • Program Components • Code in Executions • Synchronization Objects • Other Software Abstractions • Hardware Abstractions • Network Abstractions
Data Analysis • Quantitative Performance • Automating Performance Diagnosis • Perturbation Analysis
Harrison institute of biotechnology Case Study
Guiding Principles and Characteristics • Scalability • Automate the search for performance problems • Provide well-defined data abstractions • Support heterogeneous environments • Support high level parallel languages • Open interfaces for visualization and new data sources • Streamlined use
System Overview • Basic Abstractions • Metric-focus grid • Time Histograms • Components of the System • Main Paradyn Process • Performance Consultant • Visualization Manager • Data Manager • User Interface Manager • Paradyn daemons • External Visualization Processes.
HIB Table Visualization Histogram Visualization Tabular Summary CPU 3.0 4.0 Messages 117 81 Visualization Manager Visi Thread Visi Thread User Interface Manager Performance Consultant Data Manager Metric Manager Instrumentation Manager Metric Manager Instrumentation Manager HIB Daemon(s) Application Processes Application Processes
Dynamic Instrumentation • Dynamic Instrumentation Interface • Metric Manager • Instrumentation Manager • Points, Primitives and Predicates Foo() { …. …. } addCounter(fooFlg, 1) addCounter(fooFlg, 1) SendMsg( dest, ptr, cnt, size) { …. …. } if (fooFlg) startTimer(msgTme, ProcTime) if (fooFlg) stopTimer(msgTme)
Instrumentation generation • Base Trampolines • Mini-Trampolines • Data Collection • Internal Uses of Dynamic Instrumentation • Resource Discovery • Collection of dynamic mapping information for HLL.
The W3 Search Model and the Performance Consultant • Why ? Where ? When ? • The “Why” Axis • Why is the application performing poorly ? • Potential performance problems are represented as hypotheses and tests. • Hypotheses represent activities universal to all parallel computations. • Hypotheses can be refined into more refined hypotheses using a search hierarchy. • Tests are Boolean functions that evaluate the validity of a hypotheses. • Tests are expressed in terms of a threshold and metrics calculated by the Instrumentation Manager.
A sample “why” axis with several hypotheses TopLevelHypotheses SyncBottleNeck FrequentSyncOperations HighSyncBlockingTime HighSyncHoldingTime HighSyncContention
The “Where” Axis • Where is the performance problem ? • Pinpoints the problem specific to program components. • Each hierarchy in “where” axis has multiple levels, with the leaf nodes being the instances of resources used by the application. SyncObject Message SpinLock Barier Semaphores
The “When” Axis • When does the problem occur ? • Represents periods of time during which performance problems can occur. • The Performance Consultant • This module discovers performance problems by searching the space defined by W3 Search Model. • Fully automated search but also allows user to make manual refinements.
Open Visualization Interface • Paradyn provides a simple library and RPC interface to access performance data in real-time. • Visualization modules (visi’s) in Paradyn are external processes that use this library and interface. • Currently provides visi’s for time-histograms, bar charts and tables.
Conclusion Computational grids are focused on high performance distributed computing. To achieve high performance, such systems need to provide tools that enable the programmer to realize the potential performance inherent in such a system.