Download
1 / 36
360 likes | 393 Vues
Analyze gestational age and birth weight correlation, maternal smoking status effect, linear relationships in regression models, residual plot interpretation, correlation matrix examination, and regression model comparison. Evaluate associations and predictions using R-squared and coefficient analysis.

E N D
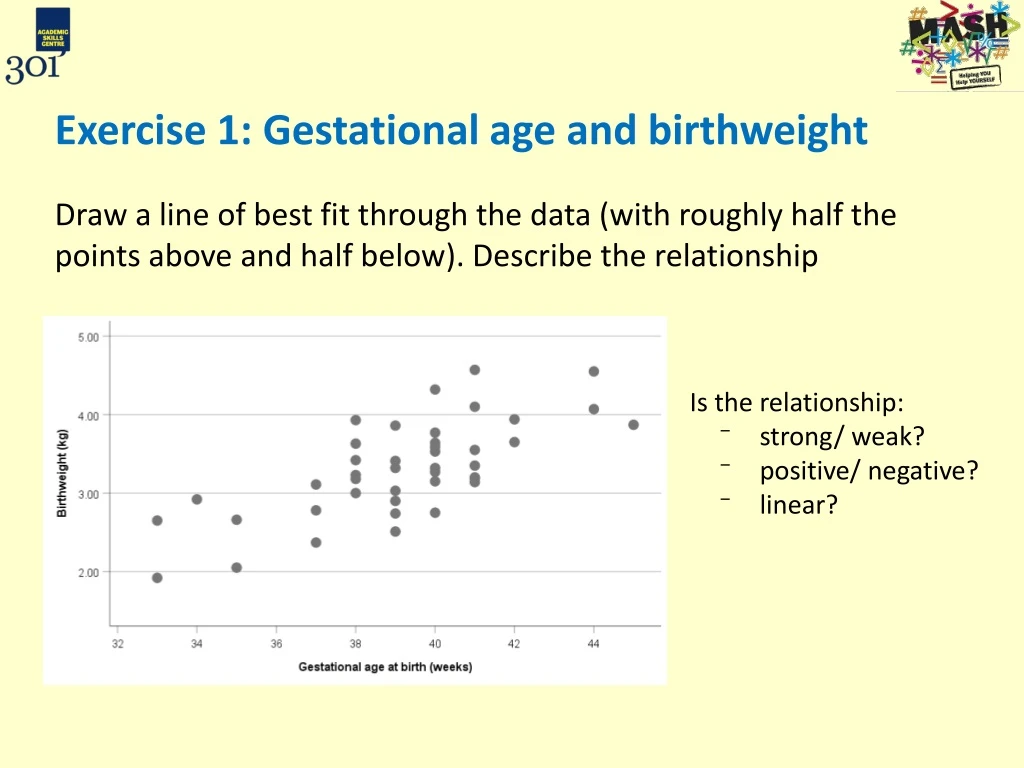
Exercise 1: Gestational age and birthweight Draw a line of best fit through the data (with roughly half the points above and half below). Describe the relationship Is the relationship: • strong/ weak? • positive/ negative? • linear?
Exercise 2: Interpretation Interpret the following correlation coefficients using Cohen’s classification and explain what they mean. Which correlations seem meaningful?
Exercise 3a: Scatterplot Use Recode > Transform into Different Variables to construct a variable for maternal smoking status (non-smoker / smoker) Construct a scatterplot for birthweight and gestational age? Use Set Markers by to distinguish between smokers and non-smokers • Is there evidence of a linear relationship • Interpret the correlation coefficient. What does it mean? Note: • Think about which variable should be on the x axis (horizontal) and which should be on the y axis( vertical) • If you double-click on the graph you can open the Graph dialog window and edit the chart, for example change the colours used for smokers and non-smokers
Exercise 3b: Scatterplot & Correlation Construct a scatterplot and calculate Pearson’s correlation coefficient for birthweight and maternal pre-pregnancy weight? • Is there evidence of a linear relationship • Interpret the correlation coefficient. What does it mean? Note: think about which variable should be on the x axis (horizontal) and which should be on the y axis( vertical)
Exercise 4 Investigate whether mother’s pre-pregnancy weight and birth weight are associated using a simple linear regression
Exercise 4: regression Adjusted R2 = Does the model result in reliable predictions? ANOVA p-value = Is the model an improvement on the null model (where every baby is predicted to be the mean weight)?
Exercise 4: Regression Pre-pregnancy weight coefficient and p-value: Regression equation: Interpretation:
Exercise 5 Re-run the regression model, but this time, produce the residual plots. Do you think that the assumptions of normality of residuals and homogeneity of variance are met?
Exercise 6: correlations Produce a correlation matrix for the correlations between Birthweight, Gestational age, Maternal height and Maternal pre-pregnancy weight: Analyse > Correlate > Bivariate & add the 4 variables to the Variables box:
Exercise 7 With birthweight as the outcome, run a series of regression models: Model 1: Gestational age Model 2: Gestational age and maternal smoking status • Check the assumptions and interpret the output of • Does the model give more reliable predictions than the model with just gestational age? Model 3: gestational age, maternal smoking status, maternal pre-pregnancy weight Model 4: gestational age, maternal smoking status, maternal pre-pregnancy weight, maternal height Note you will need to create a variable for smoking status based on the number of cigarettes that the mother smokes (assuming that 0 cigarettes indicates someone who does not smoke)
Exercise 7: model 1 summary Adjusted R2 = Interpretation:
Exercise 7: model 2 summary Adjusted R2 = Interpretation:
Exercise 7: model 3 summary Adjusted R2 = Interpretation:
Exercise 7: model 4 summary Adjusted R2 = Interpretation:
Exercise 1: Gestational age and birthweight There is a strong positive relationship which is linear
Exercise 3b: scatterplot Is there a linear relationship? Yes!
Exercise 3b: correlation Pearson’s correlation = 0.40 Describe the relationship using the scatterplot and correlation coefficient: There is a moderate positive relationship between mothers’ pre-pregnancy weight and birth weight (r = 0.40). Generally, birth weight increases as mothers weight increases
Exercise 4: regression Adjusted R2 = 0.14 Does the model result in reliable predictions? Not really. The adjusted R2 value is 0.14. ANOVA p-value = 0.009 Is the model an improvement on the null model (where every baby is predicted to be the mean weight)? Yes as p < 0.05
Exercise 4: regression Pre-pregnancy weight coefficient & p-value: 0.034 (p = 0.009) Regression equation: y = 1.379 + 0.034 Interpretation: There is a significant relationship between a mothers’ pre-pregnancy weight and the weight of her baby (p = 0.009). Pre-pregnancy weight has a positive affect on a baby’s weight with an increase of 0.034 kg for each extra kg a mother weighs.
Exercise 5: normality of the residuals? Yes – histogram roughly peaks in the middle
Exercise 5: homoscedasticity? Yes – no patterns in residuals
Exercise 6: correlations Which variables are most strongly related to each other?
Exercise 6: correlations Which variables are most strongly related? • Gestation and birth weight (0.708) • Mothers height and weight (0.681) • Mothers height and weight are strongly related. They don’t exceed 0.8 but try the model with and without height in case it’s a problem
Exercise 7: model 1 summary Adjusted R2: 0.489 Interpretation: As p < 0.05, gestational age is a significant predictor of birth weight. Weight increases by 0.16 kgs for each week of gestation
Exercise 7: model 2 summary Adjusted R2: 0.541 Interpretation: As p < 0.05 for both smoking status and gestational age both are significant predictors of birth weight. Weight increases by 0.16 kgs for each week of gestation. Mothers who smoke have, on average babies who weigh 0.30kgs less than babies born to mothers who do not smoke.
Exercise 7: Model 2 residual assumptions Assumptions are met
Exercise 7: Model 2 ANOVA ANOVA p-value < 0.001 Is the model an improvement on the null model (where every baby is predicted to be the mean weight)? Yes as p < 0.05
Exercise 7: Model 2 Adjusted R2 Adjusted R2 = 0.541 Does the model result in reliable predictions? Yes – the adjusted R2 is reasonably high
Exercise 7: model 3 summary Adjusted R2: 0.588 Interpretation: As p < 0.05 for all variables, all are significant predictors of birth weight. Weight increases by 0.14 kgs for each week of gestation. Mothers who smoke have, on average babies who weigh 0.30kgs less than babies born to mothers who do not smoke, and for each increase in pre-pregnancy weight of 1kg, babies weight increases by 0.02kgs, or 20gms. It is worth noting that whilst this is significant, it makes very little difference to birthweight in practice.
Exercise 7: model 4 summary Adjusted R2: 0.586 Interpretation: P < 0.05 for gestational age and smoking status. However, now that maternal height has been added to the model, neither pre-pregnancy weight nor height are significant. They are strongly related and are sharing some of the variation in birth weight when both in the model.
Exercise 7: Compare p-values • Smoking gets more significant as variables are added. • Mothers’ weight becomes non-significant once height has been added. They are strongly related and are sharing some of the variation in birth weight when both in the model.
Exercise 7: Compare R2 • Adding smoker and weight improves the fit a little bit • Adding height has not improved the fit of the model at all as the adjusted R2 decreases


