Download
1 / 22
220 likes | 374 Vues
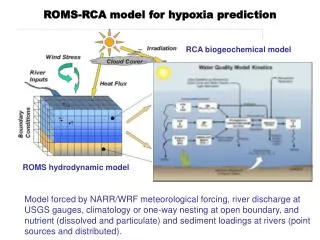
Using ROMS to Model the Distribution of Hypoxic Water in Narragansett Bay, RI USA. Deanna Bergondo and Chris Kincaid University of Rhode Island Narragansett, RI 02852 USA dbergondo@gso.uri.edu. University of Rhode Island . Narragansett Bay.

E N D
Using ROMS to Model the Distribution of Hypoxic Water in Narragansett Bay, RI USA Deanna Bergondo and Chris Kincaid University of Rhode Island Narragansett, RI 02852 USA dbergondo@gso.uri.edu University of Rhode Island
Narragansett Bay • Three drowned river valleys: West Passage, East Passage and Sekonnet River • Five major rivers: Tauton, Blackstone, Pawtuxet, Woonasquatucket, and Moshassuck • Mean salinity of 29-31ppt • Tends to be moderately stratified in summer, though some areas can be highly stratified and at some times there can be strong mixing
Narragansett Bay x x x x x x x
Bullock Reach - July 2001 • High surface DO values • Decrease in bottom DO values • Bottom DO below 3 mg/L on 7/18 • Increased variability in Bottom DO beginning 7/21
Bullock Reach - August 2002 • High surface DO values • Decrease in bottom DO values • Bottom DO below 3 mg/L on 7/31 • Bottom DO recovers 8/6
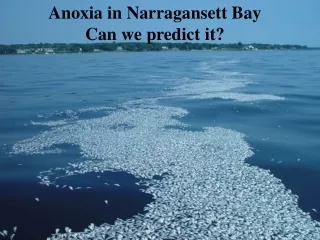
Hypoxia in Narragansett Bay Wind Moderate to High Q Low Tidal Range Low to Moderate Wind from the North Wind Low to Moderate Q High Tidal Range Moderate Wind Wind High Tidal Range Strong Wind
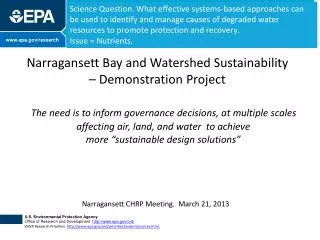
Greenwich Bay Fish Kill Pollution, rain created a toxic bathtub in Greenwich Bay Remedies will be neither easy nor cheap, environmentalists say. Sunday, August 24, 2003 BY NEIL SHEA and DANIEL BARBARISIJournal Staff Writers http://www.savebay.org/index_next.asp Photo by Tom Ardito Narragansett Bay Estaury Program
Greenwich Bay Fish Kill Photo by Tom Ardito Narragansett Bay Estaury Program
Hypoxia in Narragansett Bay 2003 Bergondo, Kester, Stoffel, and Woods, Marine Chemistry, In Press
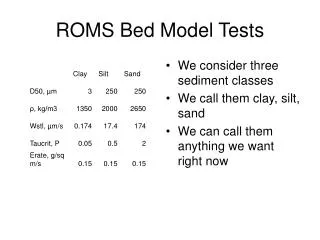
Model Domain Grid: 0.5 km x: 118 y: 70 z: 10
Flow Through Providence River Transect Depth (m) Wind from North Depth (m) Distance across channel (km)
Flow Through Providence River Transect Depth (m) West East Wind from South Depth (m) West East Distance across channel (km)
Tracking Hypoxic Water 6 m/s from SW 6 m/s from NE
Tracking Hypoxic Water Providence River Providence River Providence River
ADCP Data Under what conditions is water flushed from the Providence River into the Upper Bay and Greenwich Bay?
Future Work • Create higher resolution grid for the Upper Bay and Providence River • Incorporate data assimilation to the model • Apply the Fasham based biological model to Narragansett Bay - compare with the results of the Kremer and Nixon ecological model and field data • Use model to simulate nitrogen-reduction experiments taking place in the Bay