Geographic Information Systems (GIS)
180 likes | 211 Vues
Explore the world of Geographic Information Systems (GIS) and modern cartography in this comprehensive guide. Learn about data management, spatial analysis, and the evolution of GIS technology from its origins to its current dominance by Esri software. Discover how GIS helps collect, store, manage, and analyze spatial data, integrating information with physical locations. From manual map overlay methods to computer-based GIS models, dive into the power of spatial data and its unique link to maps. Gain insights into mapping the Earth, data modeling, and the different types of GIS databases. Explore the practical applications of GIS in various fields like urban planning, disaster relief, asset management, and more. Challenge yourself to think spatially and consider the possibilities of using GIS technology for predictive modeling and biodiversity estimation. Get hands-on with real-world GIS projects and datasets to enhance your spatial analysis skills.

Geographic Information Systems (GIS)
E N D
Presentation Transcript
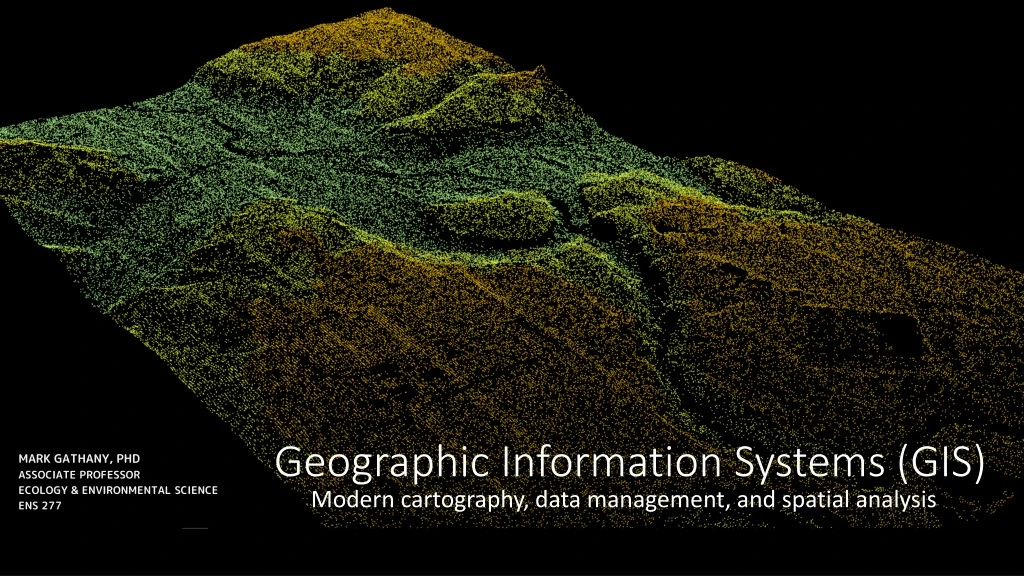
Geographic Information Systems (GIS) Modern cartography, data management, and spatial analysis • Mark Gathany, phDAssociate ProfessorEcology & Environmental ScienceENS 277
An information system Why geographic information system?
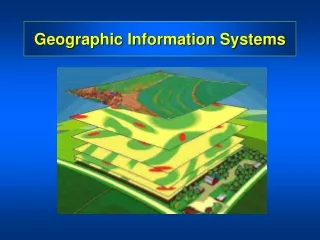
What is a GIS? • A tool to digitally abstract the real world • Information is connected to its physical location and organized into layers. • Software & hardware is used to display, organize, store, manage, and analyze this data. • GIS is dominated by Esri software (e.g. ArcMap, ArcCatalog, etc.)
Genesis of GIS…necessity (and opportunity) is the mother of invention. GIS’s origins lie in thematic cartography Born out of urban planners and natural resource conservationists thatused the method of manual map overlay (combining various themes) Manual map overlay as a method was first described comprehensively by Jacqueline Tyrwhitt in a 1950 planning textbook McHarg used blacked out transparent overlays for site selection in Design with Nature Tomlinson develops first computer based GIS for analysis of Canadian forests.
Defining GIS • Different definitions of a GIS have evolved in different areas and disciplines • All GIS definitions recognize that spatial data are unique because they are linked to maps (space matters!) • A GIS at least consists of a(n): • Informaiton database • Map information • Computer-based link between them Nighttime in Paris
Models of the Earth The earth can be modeled as a • sphere • oblate ellipsoid • geoid A map is a model! A model is an abstraction of reality!!!
Map data models Raster a grid of cells containing one value per pixel. Remotely sensed imagery or modeled. Surface a sort of raster-vector hybrid with the unique capacity to display 3D data. LiDAR and TINs. Vector object, or feature-based, discrete points, lines, and areas. Field collections. LiDAR point cloud of Indian Mound Reserve, Cedarville, Ohio Digital Elevation Model (DEM) of Kalkaska County, Michigan Cedarville University & surrounding area: parcels and tree inventory
Vector model • Originally developed from the arc-node (point-line) model • Basic premise: • An area… • is lines… • is points… • that have coordinates. • We typically describe things in greater detail than…point…line…
The GIS Database • We manage database information by theme, or layer (e.g. trees, bedrock, etc.) • Layer attributes are stored in the attribute table as column headers • Records (unique objects) are stored as rows. • The contents of an attribute for one record is a value. • A value can be numerical or text. record
Raster & surface models • Rasters are square tessellations, or grids • Each grid cell has one, and only one, value (though we may join tables on this information) • At least two grid cells must have coordinates • Common rasters are: • DEM (digital elevation model) each cell has an elevation • LULC (land use land cover) each cell has value corresponding to dominant vegetation/cover My house……well actually the grid cell in which my house is located that is “medium intensity developed”
So what is a map? A map is an abstraction of the real world
The power of mapping Cost savings from greater efficiency • package delivery routes Better decision making • disaster relief and prevention Improved communication • placed-based storytelling Better record keeping • asset management Managing geographically • planning, modeling, developing
Your turn… • Write down five things “spatial things” here on campus… • Share with a neighbor. • Could you depict these in a map? As features (points, lines, or areas)? As surfaces? • How would you collect information about these features? Get it into a computer? • What information would you collect? • Among the layers you have…what questions could you ask about the relationships?
Upcoming opportunities… SU 2018 – participation in NSF Macrosystems Study. Can we estimate biodiversity from remotely sensed imagery? SU 2018 – Au Sable Institute I teach Land Resources (GIS portion) and Environmental Applications for GIS FA 18 – ENVS 2100 – Principles of GIS Introduction to modern cartography and use of GIS to display, store, manage and analyze spatial data. Also includes the acquisition and use of GPS and Landsat data. SP19 – BIO 4880 – Spatial Analysis Topics & Techniques: advanced GIS & spatial analysis, geodatabase design, drone imagery, LiDAR, imagery processing, and remote sensing.
Practice • The Ohio Census Data, Conservation Easements, and LULC. • Talk to me about your interests/applications/questions • GPS unit (or phone with TrackKit) and output to Google Earth or ArcMap • Advanced • Various workbook chapters and datasets from geodatabase design to remote sensing • Can we use GIS to predict West Nile Virus? • What urban centers are at risk if the Ogallala Aquifer is emptied?