Download
1 / 20
200 likes | 223 Vues
This study presents a new high-resolution precipitation dataset created using optimal interpolation (OI) techniques from multiple passive microwave satellite estimates, minimizing errors and discontinuities. The methodology, including OI stages and spatial-temporal domain combination, is detailed. Comparison with other datasets shows high correlation and low variability, with potential applications in climate studies. Future directions include generating diurnal data and understanding anomalous shifts in datasets.

E N D
A new high resolution satellite derived precipitation data set for climate studies Renu Joseph,T. Smith, M. R. P. Sapiano, and R. R. Ferraro Cooperative Institute of Climate Studies (CICS), University of Maryland Joseph, R., T M Smith, M R P Sapiano and R R Ferraro, 2009: A New High Resolution Satellite Derived Precipitation Data Set for Climate Studies, Journal of Hydrometeorology, in press.
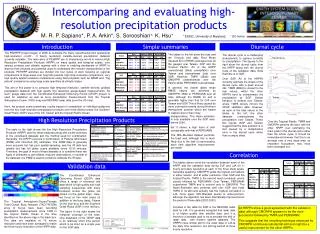
Cooperative Institute of Climate Studies (CICS) High Resolution Optimally interpolated Microwave Precipitation from SatellitesCHOMPS • Objectives • To create a High Resolution Data set • (Temporal – Daily, Spatial - 0.25° ) • Utilize all available passive microwave satellite estimates to develop improved global daily rainfall time series (No IR values used) • SSM/I, AMSU, AMSR-E and TMI • Use most recent/accurate and consistent retrieval schemes • Use Optimal Interpolation as the merging scheme • Why? • Attempt to reduce discontinuities in data • Using all possible sensors reduces diurnal sampling errors • Use of OI reduces random errors • Uses of our HR Data product • Created using a different method => Another verification source • Highlights OI’s feasibility as a methodology for the creation of a high resolution precipitation product • Comparable to the other currently available merged precipitation data sets.
Before combining the data using OI Ensure minimal biases in the data (due to instruments, algorithms) Time of Day sampling
AMSU TRMM AMSR-E SSM/I O-1Z }OI … … … … … 12-13Z Overall Methodology • The Microwave estimates are binned into 0.25º hourly bins • These are combined using OI to create an intermediate hourly product • A common daily 1° snow-ice mask is used • Hourly values are then aggregated to produce a daily estimate … … … … …
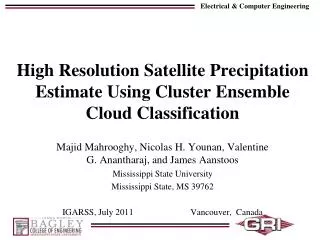
Noise to signal estimates Optimum Interpolation • OI is a linear combination (weighted average) of the data that influence the point. • Chosen to minimize random errors. • OI performed in three stages • Combination of the co-located satellite data • Individual precipitation estimates combined using weights that contain information about the satellite estimates • Weights are inversely related to the noise to signal variance ratio • OI for the spatial domain • OI is a weighted average of the nearest neighbors • Weights are calculated based on the error estimate and the correlation over neighbors • Combined in the temporal domain • Daily values are computed only when at least four values are filled in a day. μij - spatial correlation over neighboring points μik - correlation of neighboring point and estimated points Both are functions of distance between the points
TAO/TRITTON comparisons Hayes, S. P., et. al., 1991: TOGA/TAO: A moored array for real-time measurements in the tropical Pacific Ocean, Bull. Am. Meteor. Soc., 72, 339–347.
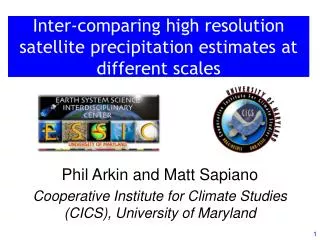
RMSD Comparison with other HR estimates • Very good overall comparison • Correlation > 0.9 • CHOMPS-noA low variability than CHOMPS • CHOMPS-noA • TMPA • CMORPH • MWCOMB • GPCP1DD
RMSD Comparison with other HR estimates • Very good overall comparison • Correlation > 0.9 with exception of GPCP1DD in the extra tropics • CHOMPS-noA low variability than CHOMPS • CHOMPS-noA • TMPA • CMORPH • MWCOMB • GPCP1DD
Oct 2003 – Apr 2004 Intraseasonal Oscillation
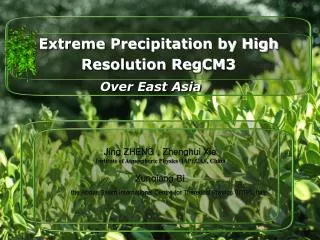
Summary CHOMPS (2000-2007) and CHOMPS-noA (1998-2007) • Used only passive microwave data • Created using the latest and most consistent algorithm so no discontinuities • OI minimizes random errors • Comparable to other high resolution precipitation products • Captures the similar anomalies • Fewer discontinuities • Where do we go from here? • Create diurnal data at the appropriate spatial and temporal resolution Joseph, R., T M Smith, M R P Sapiano and R R Ferraro, 2009: A New High Resolution Satellite Derived Precipitation Data Set for Climate Studies, Journal of Hydrometeorology, in press.
Shift in PDF in TMPA in 2000 probably due to insertion of AMSU • Shift in CHOMPS-noA in 1998 could be a reflection of the ENSO • Don’t as yet understand the GPCP 1DD data shift Anomalous PDFs indicate shifts in data
For the 5-year period CMORPH, MWCOMB and PERSIANN has shifts in PDFs. CMORPH & MWCOMB is insertion of data Anomalous PDFs