Download
1 / 28
290 likes | 494 Vues
High-Resolution Satellite-Derived Ocean Surface Winds in the North Atlantic. Dmitry Dukhovskoy, Mark Bourassa, Paul Hughes Center for Ocean-Atmospheric Prediction Studies Florida State University Support from the NASA OVWST. Nordic Seas Region.

E N D
High-ResolutionSatellite-Derived Ocean Surface Winds in the North Atlantic Dmitry Dukhovskoy, Mark Bourassa, Paul Hughes Center for Ocean-Atmospheric Prediction Studies Florida State University Support from the NASA OVWST
Nordic Seas Region • Water mass transformation and production of high-density water in the Barents Sea through cooling and brine rejection during ice freezing Monthly average net fluxes can exceed 400 W/m2 during winter (Hakkinen and Cavalieri, JGR, 1989) “The Nordic Seas region is one of the most synoptically active and variable areas of the planet, especially during winter” , Tsukernik et al., 2007 • Shelf-derived dense water contributes to the Arctic Ocean halocline and deep water (Aagaard, 1981; Cavalieri and Martin, 1994; Jones et al., 1995) • Atlantic Water undergoes modifications in the Greenland Sea through cooling and mixing with Arctic water masses • A very dense water mass is formed in the Greenland Gyre. It overflows the Denmark Strait sill contributing to the bottom North Atlantic water.
Vertical Temperature Profile, February, GDEM 3 Canada Basin
Cyclones in the Nordic Seas Distribution of mean SLP and mean 500 hPa height (contours) fields, November - March, 1979 – 1999 Total winter cyclone count (November – March), 1979 - 1999 Tsukernik et al., JGR, 2007 Tsukernik et al., JGR, 2007
Cyclone Classification Polar Low over the Barents Sea in NOAA satellite image Large-scale low-pressure systems: Spatial scale: O(1e3) km Time scale: days-week NOAA 04:33 UTC 20 December, 2002 Meso- & small-scale low pressure systems (e.g., Polar Lows): Spatial scale: O(100) km Time scale: hours – day Very strong winds (>17 m/s) From: L. Hamilton, The European Polar Low Working Group, 2004
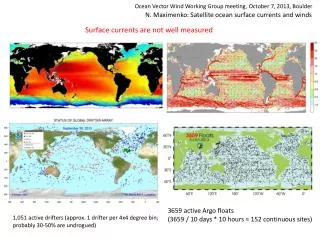
Are Small-Scale Cyclones Represented in the Wind Fields? “Yet owing to their small scale, polar lows are poorly represented in the observational and global reanalysis data <…>”. Zahn & von Storch, Nature (467), 2010 A polar low embedded in a large cold air outbreak on 2 March 2009. Greenland in the top left corner and Iceland is partly covered by a cloud in the upper right quadrant (http://polarlows.wordpress.com/) A classic Barents Sea polar low, February 9, 2011
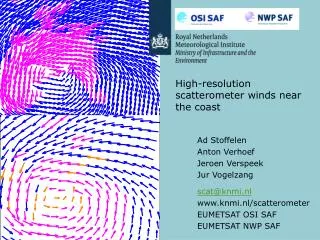
Surface Winds from Cross-Calibrated Multi-Platform Ocean Surface Wind Components (CCMP) and National Center for Environmental Prediction Reanalysis 2(NCEPR 2), October 2007 - April 2008 ANIMATION • Period covered: 1891 – present; • Assimilated observations: surface pressure, sea surface temperature and sea ice distribution, scatterometer winds (since 2002) • Products include 3- and 6-hourly data on ~1.9 x 1.9°global grid, monthly, daily averages • Period covered: July 1, 1987 – December 31, 2008; 0.25 resolution, 6hr fields • The data set combines data derived from several scatterometer satellites • Satellite data are assimilated into the ECMWF Operational Analysis fields
Winter Mean EKE (2000 – 2007) CCMP NCEPR 2 EKE (J)
Maximum Wind Speeds, Winter 2000-2007 CCMP NCEPR 2 11 17 23 29 35 41 47 11 17 23 29 35 41 47
Time Series of Wind Speed, Winter 2004-2005 Barents Sea, 2004
Coefficients of Morlet Wavelet Transformation of Wind Speed Time Series, Greenland Sea, winter 2004-2005 NCEP CCMP
Flux Estimates on the Basis of CCMP and NCEPR 2and SST from HYCOM/CICE(ARCc0.08 - NRL SSC)
Winds on 12-19-2007 Better resolve horizontal structure and intensity of large-scale features 19-12-2007, 6:00 UTC NCEPR 2 CCMP 7 13 25 19 31 7 13 25 19 31 28 m/s 43 m/s Category 2 Hurricane on Saffir-Simpson scale
Heat and Momentum Fluxes, December 19, 2007 6:00 NCEPR 2 winds CCMP winds 210 150 Heat Fluxes, W/m2 Heat Fluxes, W/m2 90 -240W/m2 -457W/m2 30 -30 -8 TW -90 -11 TW -150 -210 >2.1 1.8 Momentum flux, N/m2 Momentum flux, N/m2 1.5 1.2 0.9 0.6 2.2N/m2 7.5 N/m2 0.3 0
Summary • Large-scale atmospheric circulation: • the CCMP and NCEP data generally agree • discrepancies between the two wind products : • wind direction • location, size, and timing of storms • on average, the NCEP winds have higher speeds compared to the CCMP winds • in storms, the CCMP winds have higher peak values than the NCEP winds • Meso- and small-scale cyclones are not resolved in the NCEP data. • Time spectra of the NCEP and CCMP winds look similar. Wavelet transform reveals discrepancies between the two wind time series in the frequency/time space. • (4) Spatial spectra indicates noticeable differences in dominant length scales of the NCEP and CCMP winds. • (5) Ocean response to the CCMP and NCEP winds is anticipated to be different
Ocean Response to a Cyclone Turbulent Heat Fluxes Upper ocean heat content Cyclone Barotropic response - Surge - Shelf waves Baroclinic response - Internal gravity waves - Inertial oscillations - Deepening of the pycnocline - Upwelling in the wake of a cyclone Momentum Flux Reed, JGR, 1983; Large et al., Rev. Geophys., 1994
Winter Wind Speed, 2000-2007 NCEP CCMP Greenland Sea Barents Sea Greenland Sea Barents Sea
T/S Sections in the Barents Sea, GDEM 3, October - December Temperature Salinity Kara Sea Kara Sea Barents Sea Barents Sea 35.0 35.1 34.3 34.4 34.5 34.6 34.7 34.8 34.9
Coefficients of Morlet Wavelet Transformation of Wind Speed Time Series, Barents Sea, winter 2004-2005 NCEP CCMP
CCMP winds vs NCEPR 2 winds National Center for Environmental Prediction Reanalysis (NCEPR 2) Cross-Calibrated Multi-Platform Ocean Surface Wind Components (CCMP) • The Twentieth Century Reanalysis Project, supported by the Earth System Research Laboratory Physical Sciences Division from NOAA and the University of Colorado CIRES/Climate Diagnostics Center • Global climatologicaldata reconstruction from 1891 • The product is obtained by assimilating surface observations of synoptic pressure, sea surface temperature and sea ice distribution • Products include 3- and 6-hourly data on ~2 x 2°global grid, monthly, daily averages, etc. • Fields: SST, SSS, atmospheric temperature, precipitation, heat fluxes, radiation, … • The primary source of forcing parameters in most Arctic Ocean models • Project is funded by NASA • Gridded data set of ocean surface vector winds at 0.25°resolution • Period covered: July 1, 1987 – December 31, 2008 • The data set combines data derived from several scatterometer satellites • Satellite data are assimilated into the ECMWF Operational Analysis fields
Generation of Internal Waves by a Moving Cyclone Internal waves Baroclinic topographic waves
Water Mass Transformation in the Nordic Seas • Water mass transformation and production of high-density water in the Barents Sea through cooling and brine rejection during ice freezing • Shelf-derived dense water contributes to the Arctic Ocean halocline and deep water (Aagaard, 1981; Cavalieri and Martin, 1994; Jones et al., 1995) • Atlantic Water undergoes modifications in the Greenland Sea through cooling and mixing with Arctic water masses • A very dense water mass is formed in the Greenland Gyre. It overflows the Denmark Strait sill contributing to the bottom North Atlantic water.
Schamtic representation of high-density shelf plume sinking down the continental slope Maintenance of the halocline by lateral advection of shelf-derived water masses Based on Aagaard, DSR, 1981 Aagaard, DSR, 1981