Download

1 / 23
230 likes | 393 Vues
Statistical Post-Processing of General Time Series Data - With Wind Turbine Applications. LeRoy Fitzwater, Lance Manuel, Steven Winterstein. Implementation/Interpretation of Standards: IEC & IS0. Issues: How to “Fill In”/Extrapolate Load Spectra for Ultimate & Fatigue Loads:

E N D
Statistical Post-Processing of General Time Series Data - With Wind Turbine Applications LeRoy Fitzwater, Lance Manuel, Steven Winterstein
Implementation/Interpretation of Standards: IEC & IS0 • Issues: • How to “Fill In”/Extrapolate Load Spectra for Ultimate & Fatigue Loads: • US wind consultants (e.g. Kamzin) • National Labs (e.g. RISO-Denmark, ECN-Netherlands, NREL/Sandia-United States) • Academic Research (e.g. RMS) • Design Bases for Ultimate Loads: • Series of Design Gust Scenarios • Full Turbulence Simulation
Implementation/Interpretation of Standards: IEC & IS0 • Issues: (cont’d) • How Much Data? • How Uncertain Given the Imperfect Information • Limited Data from Prototype Machines • Imperfect Analysis Models (e.g. Cd Uncertainty) • Cover with Appropriate “Safety” Factor
Loads: A Bottom-Up Approach • Short-term Problem (Given a Stationary Wind/Sea State) • Have loads data {L1, …, Ln}, (e.g., rainflow ranges) for a given wind condition model statisitical moments mi: • m1 = Average (Mean) Load • m2 = Normalized second-moment (Coefficient of Variation): • m3 =Normalized third-moment (Coefficient of Skewness): • m1 =Normalized fourth-moment(Coefficient of Kurtosis): • Algorithm: FITS estimates load distribution from mi
Loads: A Bottom-Up Approach • Long-term Problem • Across multiple wind conditions: Model load moments mi vs. wind parameters V and I: • Where • Power -law flexible form; permits: • Linear dependence (b,c = 1) • Superlinear Dependence (b,c > 1) • Sublinear Dependence (b,c < 1) • No dependence (b,c = 0) • a,b,c estimated by linear regression (and their uncertainties) • Vref, Iref = central V, I values (geometric means) • Algorithm: PRECYCLES estimates a, b, c, and their uncertanties; provides input to reliability analysis routine CYCLES (FAROW)
Option 1- Model Process Two-Sided Distribution X=C0+C1N+C2N2+C3N3 N=Normal Ci’s depend on the 4 Statistical Moments of X a3= skewness (right vs. left tail) a4=Kurtosis (“heaviness” of both tails) Option 2- Model Ranges/Peaks One-Sided Distribution Y=C0+C1W+C2W2 W=Weibull Ci’s depend on the 3 Statistical Moments of Y Moment-Based Models of Dynamic Loads & Response - Two Options
Option 1- Model Process Only Need Original History No Peak Counting Must Approximate Peaks Narrow Band Approximation Can Model Fatigue and Extremes Option 2 - Model Ranges/Peaks Can use Stats of Rainflow Ranges Directly (often stored) Fewer Moments Needed; Simpler Fitting May Need to Filter Small/Uninteresting Ranges Can Model Fatigue and Extremes Moment-Based Models of Dynamic Loads & Response - Critical Issues & Tradeoffs
Data Analysis Algorithm: FITS(Stanford University/Sandia National Laboratory) • Other Routines • FITTING: 4-Moment Distortions of Normal and Gumbel Distributions • FAROW/CYCLES: Fatigue Reliability Analysis (Given Moment Based Loads) • PRECYCLES: Fits Moments vs. V, I Input to FAROW/CYCLES
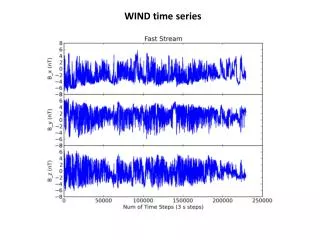
HAWT Data Set • Description: • Horizontal Axis Wind Turbine (HAWT) • 101 Data Sets; each of Ten-Minute Duration • Wind Speed: 15 to 19m/sec • Subset of Collected Data • Turbulence Intensity: 10 to 23 percent • Rainflow-counted cycles or ranges available • Flap(Beam) and Edge(Chord) Bending Moment ranges available • Data were gathered as counts of ranges exceeding specific levels of a bending moment range. • Goal: • Long Data Sets - “True” Long Run Statistics • Fit to Subsets - Assess: • Accuracy (Bias) • Uncertainty
Summary • I.Estimating Load Distributions (Spectra) From Statistical Moments • Fairly Mature (2nd Generation) • Special Issues: • Fit Process or Ranges/Peaks • Periodicity • Response Events • II.Uncertainty/Confidence Bands From Limited Data • Methods Available - Simulation vs. Bootstrap (e.g. MAXFITS) • Tests Needed to Validate (via Long Data Sets)
Summary (cont’d) • I + II Statistical Load Characterization • Combine with Reliability Analysis • Pf (case specific) • Proposed Guidelines/Standards • Implied Pf Across Cases • Target Pf • Consistent Safety Factors (information sensitive)