Download
1 / 1
10 likes | 180 Vues
Evolving Soil Test P and K Levels on the Wisconsin Integrated Cropping Systems Trial J.O. Baldock 1 , J.L. Posner 2 , J.L. Hedtcke 2 1 AGSTAT, Verona, Wisconsin 2 Department of Agronomy, The University of Wisconsin-Madison. Fig. 2: Median STP trends in WICST grain systems.

E N D
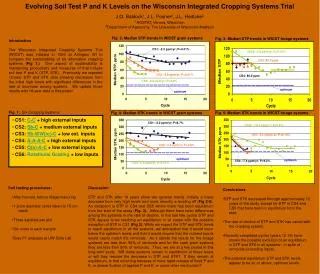
Evolving Soil Test P and K Levels on the Wisconsin Integrated Cropping Systems TrialJ.O. Baldock1, J.L. Posner2, J.L. Hedtcke2 1AGSTAT, Verona, Wisconsin 2Department of Agronomy, The University of Wisconsin-Madison Fig. 2: Median STP trends in WICST grain systems Fig. 3: Median STP trends in WICST forage systems Introduction The Wisconsin Integrated Cropping Systems Trial (WICST) was initiated in 1990 at Arlington WI to compare the sustainability of six alternative cropping systems (Fig 1.) One aspect of sustainability is maintaining productivity and measures of that include soil test P and K (STP, STK). Previously we reported 12-year STP and STK data showing decreases from the initial high levels with significant differences in the rate of decrease among systems. We update those results with 16-year data in this poster. CS1: -2.3 ppm/yr; P<0.01% CS6a: -6.9 ppm/yr; P<0.01% CS5: 82.3 ppm CS2: -2.8 ppm/yr; P<0.01% CS4: 80.2 ppm CS3: -2.8 ppm/yr; P=2.2% optimum optimum Fig. 1: Six Cropping Systems Fig. 4: Median STK trends in WICST grain systems Fig. 5: Median STK trends in WICST forage systems • CS1: C-C + high external inputs • CS2: Sb-C + medium external inputs • CS3: Sb-WW(rc)-C + low ext. inputs • CS4: A-A-A-C + high external inputs • CS5: O(a)-A-C + low external inputs • CS6: Rotational Grazing + low inputs CS1: -2.2 ppm/yr; P=8.7% CS6a: -10.3 ppm/yr; P=2.9% CS5: -10.4 ppm/yr; P=0.10% CS2: -5.8 ppm/yr; P=2.8% optimum optimum CS4: -7.6 ppm/yr; P=9.2% CS3: -6.9 ppm/yr; P<0.01% • Soil testing procedures: • After harvest, before tillage/manuring • 1.9-cm diameter cores taken to 15-cm • depth • Three samples per plot • Six cores in each sample • Bray P1 analyses at UW Soils Lab Discussion STP and STK after 16 years show two general trends: initially a linear decrease from very high levels and more recently a leveling off (Fig 2-5). An exception is STP in CS4 and CS5 where there has been equilibrium from the start of the study (Fig. 3). Although there have been differences among the systems in the rate of decline, in the last few cycles STP and STK appear to be reaching an equilibrium in all cases with the possible exception of STP in CS1 (Fig 2). While we expect the STP and STK levels to reach equilibrium in all the systems, we anticipated that it would occur below the optimum levels and that it would require that the nutrient inputs would nearly match the removals. As it stands the inputs for the forage systems are less than 90% of removals and for the cash grain systems they are less than 50% of removals. Thus, we are at a key period in this long-term study. Will these systems remain in equilibrium at these levels or will they resume the decrease in STP and STK? If they remain at equilibrium, is that occurring because of more rapid release of fixed P and K, or slower fixation of applied P and K, or some other mechanism? • Conclusions • STP and STK decreased through approximately 12 • years of the study, except for STP in CS4 and • CS5 that have been in equilibrium from the • start. • The rate of decline of STP and STK has varied with • the cropping system. • Recently completed cycles (years 12-16) have • shown the possible evolution of an equilibrium • in STP and STK in all systems-- in spite of • removals exceeding inputs. • The potential equilibrium STP and STK levels • appear to be at, or above, optimum levels.