Download
1 / 38
390 likes | 722 Vues
Fisheries of Korea. Kwang – Soo , Lim Deputy Minister for Fisheries Policy. Ministry for Food, Agriculture, Forestry and Fisheries. [ Contents ]. Marine Environment Fisheries in Korea Fisheries Policy Growth momentum for fisheries. 1. Marine Environment. Seas surrounding Korea.

E N D
Fisheries of Korea Kwang –Soo, Lim Deputy Minister for Fisheries Policy Ministry for Food, Agriculture, Forestry and Fisheries
[Contents ] • Marine Environment • Fisheries in Korea • Fisheries Policy • Growth momentum for fisheries
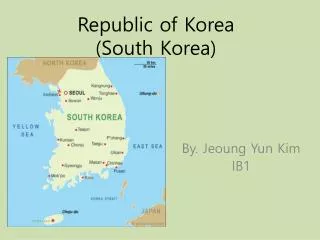
Coastline : 14,533km (South Korea 11,542km) • Islands : 4,198 (South Korea 3,153) Cold KOREA CHINA JAPAN Warm
West coast • Average depth : 44m • Mud flats • Low salinity • High nutrients • Croaker, Flounder • Prawn, Hairtail, Blue crab
East coast • Average depth : 1,700m • Cold water at the bottom • Warm water at the top • Squid, Saury, Alaska Pollack, • Yellowtail, Red crab
South coast • Anchovy, Mackerel • Eel, Sea bream, Filefish, Tuna • Center of Korean Aquaculture
Production (2010) • 3.1 million tonnes (2.1% of world production) (Unit: 1,000 tonnes)
World's Fisheries Production (2008, including aquatic plants unit = 1,000 tons)
Changes in Contribution 1980 1990 2000 2010
Fishing Vessels • Sustainable level : 39,903 vessels • Current : 47,751 (16% over) • Scraped 16,642 during ’94~’10 (1,546 billion won) 68,629 47,521 39,903 2000 2010 Goal
Aquaculture Production • Global top in aquaculture production per nation’s territory 14.2 ton / km2 * China: 42 million ton (world top), but production / territory = 4.4 ton ㎢ 14.2 8.0 7.6 4.4 3.1 2.6 • World aquaculture production (million ton) : China (42.6), Indonesia (3.8), India (3.5), Vietnam (2.5), Philippines (2.4), Korea (1.4) 1.0 Korea ChinaJapanIndiaVietnam Norway Philippines
Fishing Households 129,734 69,379
Trade (unit: 1,000 US$) liberalization of imports Import Export
Growing demand for fish • Fish consumption per-capita increased by 57% during last 10 years • Supply 40% of animal protein • China market demand is growing rapidly → export market Chinese fish consumption (kg/yr) Korean Food consumption (kg/yr) 103 30 rice 86 fish 55 22 meat 41 35 11 1998 2008 2000 2006 2009
Historyof fisheries governance 1948 Fisheries Bureauin the Ministry of Commerce and Industry 1966~ 1996 Fisheries Administration 1996~ 2007 Ministry of Maritime Affairs and Fisheries Since 2008 Ministry for the Food, Agriculture, Forestry and Fisheries
MIFAFF (Ministry for Food, Agriculture, Forestry and Fisheries)
Major management tools • Input/Output control • fishing license 3,957 / TAC for 12 species • Buy-Back program (since 1994) • scrapped 16,642 vessels • Technical measures • Closed areas and seasons, Landing, etc. • Community based management (since 2001) • managed by people who use them • increasing both participants 10 times and income 8~9% / yr.
Aquaculture management • Input controls • licenses: 13,409 (266,717 ha) • limit on aquaculture access => small-scale business • prohibition of license lease • restriction on farm size (less than 60 ha) & large company’s entry • Technical measure • restrictions on antibiotics usage • drain water quality conservation
Processing / Marketing • Processing market size: $62 billion • Certification schemes & Place-of-origin labeling system • Electronic wholesale market & internet fisheries market • HACCP on Aquaculture & processing factories, etc. • Federation of Fisheries Cooperatives • Markets around producing & consumption areas • - Consignment sale spots:160 places (landing ports : 202) • - Wholesale markets (downtown)
Fishing village & port • Fishing village renovation • Comprehensive fishing village development project (’94 ~ ) • Sister City and Village Program (city vs. fishing village) • Fishing village camp • Fishing Port • National fishing port management (110 sites) • Marine debris collecting vessel in fishing port • Overseas fishing port building (with relation to ODA)
Human resources • Human Resources Enforcement • Cultivate fisheries successor (‘81~’10): 18,750 person • Fisheries population (’10): 171,000 person • Declining and Graying Population 370 thousand person over 60 years old 171 130 36% 60% 25% 1995 2010 2020 < Fisheries Population Outlook>
Sustainable Fisheries • Commencement of New Decommission Scheme • Application-base ⇒ government’s official authority • - target: over-fishing gear (e. g. trawl) • Stock Recovery of about 30 Species by 2020 • Port (landing) Control to Prevent IUU Fishing Activities • Modernization of Fishing Vessels • Crews’ welfare & low-carbon emission
Aquaculture • Abolition of access limit (step by step) => scale-up • permit farm size more than 60 ha & license lease • allow company’s entry • Expansion of aquaculture farm • coastal to off-sea, mud flat & city (fish factory)
Marine biomass • Develop mass production tech. of seaweeds & micro-algae • Extract bio-fuel, pulp, and plastic from marine biomass • * 1 million ha. of seaweeds farm: 4,500 million liters of motor fuel (50% of domestic consumption) Bio-fuel Pulp Plastic Medicine
Bio-medicine • Challenge: Difficulty in collecting marine life from nature • Solution: Aquaculture-mass production of useful marine life Cone shell in naturemass production by aquaculture extraction
Genetic breeding • Flounder, abalone, and other major species • 3rd generation flounder : 40% • - Faster growth rate • - Stronger for disease. • - Expected to lower production • cost by 40% * Norway salmon: 10th generation. 300% faster growth rate. Occupies 70% of world market
Aqua-pet • World market size : 23 billion US$ • Marine ornamental fish : decreased by resource depletion, reef destruction • Development of new species for aquaculture
Food industry • Expanding HACCP: fishing farm to markets • Adopting Eco-labeling system (proposed by FAO) SAFETY HYGIENE • Building Fisheries Base Processing Center • - Simple Collection -> Packing, clean & processing • Creating local food industry complex • Promoting local Food brands QUALITY
Human resources Spread of success story Reinforcement of consulting & info. sharing CEO Incentives for nation certification holders Silver tech. to cope with aging society ENGINEER International Fisheries Education Institution International Observer Center GOLBAL